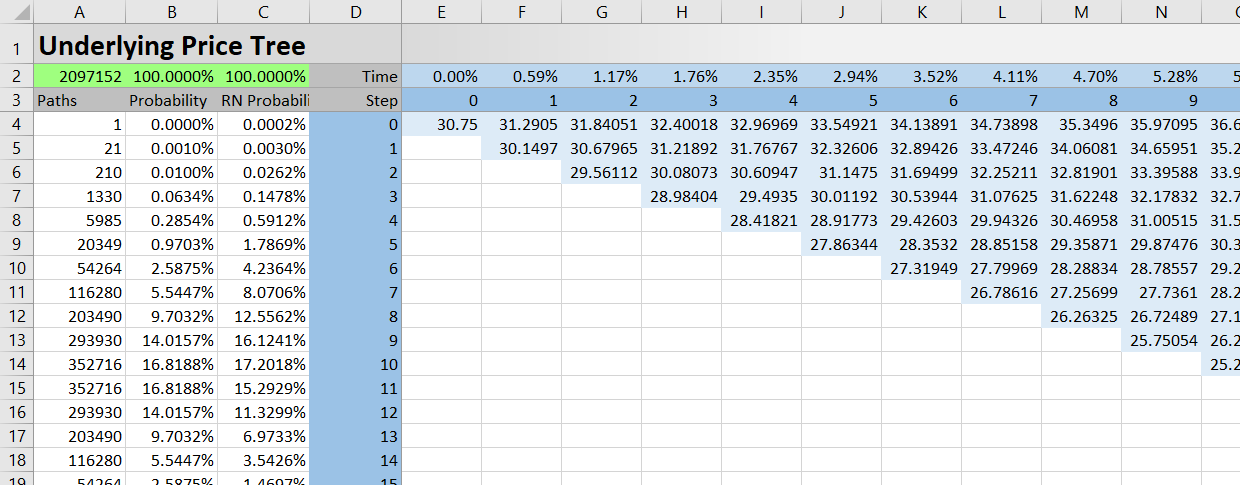
The page explains the UndTree sheet of the Binomial Option Pricing Calculator, where you can view the underlying price tree generated by the binomial model.

Underlying Price Tree Structure
The UndTree sheet contains the underlying price binomial tree with a given number of steps (which you can set in cell C4 in the Main sheet).
Individual steps are in columns starting from step 0 in column E and going to the right, possibly up to step 101 in column DB.
You can see the step numbers in row 3. Row 2 shows individual steps as percent of year from the moment of valuation.
In binomial trees, the number of nodes in a step increases by one with each additional step:
- Step 0 has a single node – the current underlying price in cell E4.
- Step 1 has two nodes – the underlying prices which result from a single step increase or decrease, respectively, from the current (step 0) underlying price.
- Step 2 has tree nodes. The upper node is a result of two increases, the lower node is a result of two decreases, and the middle node is a result of one increase and one decrease.
- And so on.
The number of nodes in each step equals the step number plus one.
When fewer than 101 (the maximum) steps are set, the unused columns on the right won't be showing any values, although the formulas will still be there.
Final Step Underlying Prices
In any case, the last step (the last column with visible values) is showing different underlying prices at the option's expiration. These prices, while all considered by the model, have different weights. Generally, the extremely high underlying prices on the upper end, as well as the extremely low prices on the lower end, are far less likely than the moderate prices in the middle. This is because underlying price can get to the middle nodes through many different paths, combining up and down moves in various order, while only a few paths lead to the extreme prices on both ends.
The size of single step up and down moves depends on a combination of inputs, such as the selected pricing model, volatility and interest rate. For more details, see the individual model pages in the models section.
You can see the number of paths leading to each final step node in column A. Cell A2 shows total number of paths.
In column B, you can see the probabilities of individual underlying prices, calculated as number of paths divided by total paths.
Column C shows risk neutral probabilities.
Relationship to the Other Tree Sheets
All the tree sheets (UndTree, ExDivTree and OptTree) have exactly the same layout, described above.
As a result, the same cell (same column and row coordinates) represents the same node in all trees. A particular cell in the UndTree sheet shows underlying price at a particular node, while the same cell in the OptTree sheet shows option price at the same node. When working with discrete dividends, the ExDivTree sheet shows the uncertain part of underlying price at that node (underlying price excluding present value of the dividend).