This page explains how to do scenario analysis in the Binomial Option Pricing Calculator.
What Scenario Analysis Does
Scenario analysis allows you to model combined effects of various factors on option prices and Greeks. It can help answer questions such as which strike price or which expiration to select for a potential trade, which option to add to an existing position if you want to adjust some exposure (e.g. gamma or theta) in a particular way, or how an option would behave with different combinations of volatility and underlying price.
Scenario Analysis Settings
All settings are located above the chart in the Main sheet.
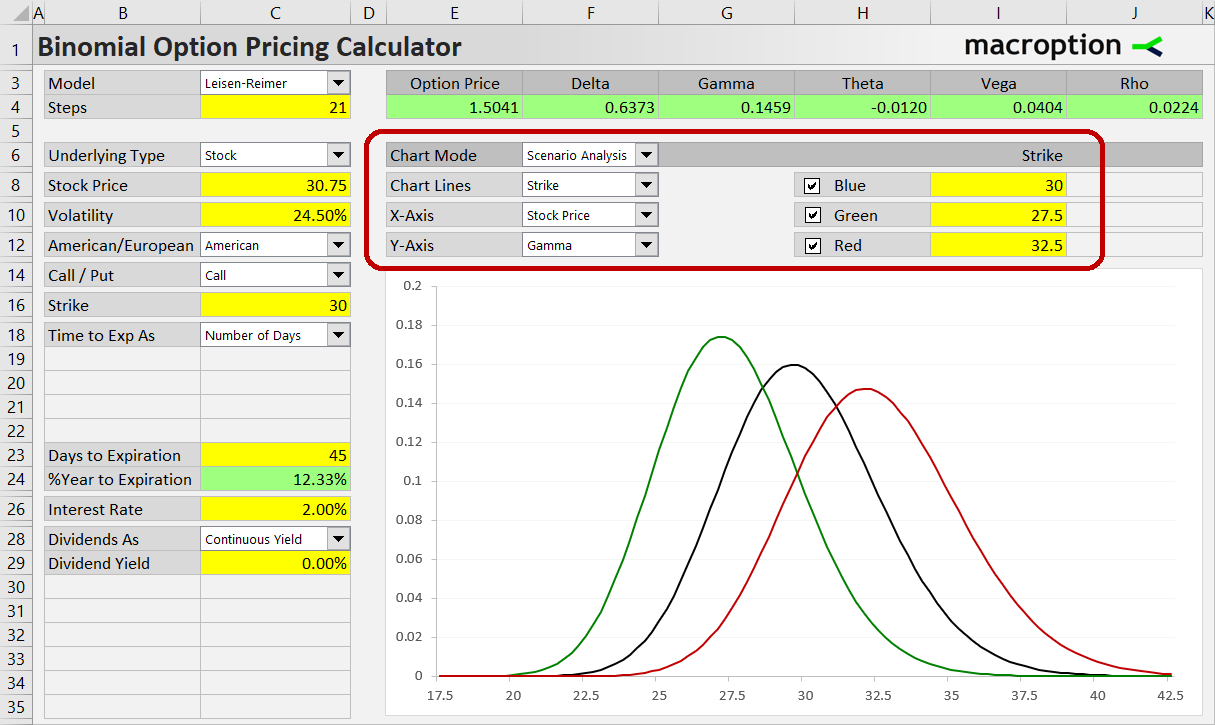
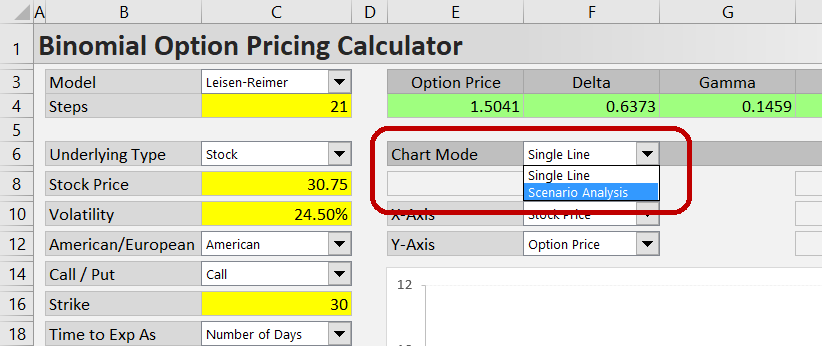
First, make sure "Scenario Analysis" is selected in the Chart Mode dropdown box in cell F6.
Then you need to select what you want to model and enter scenario inputs.
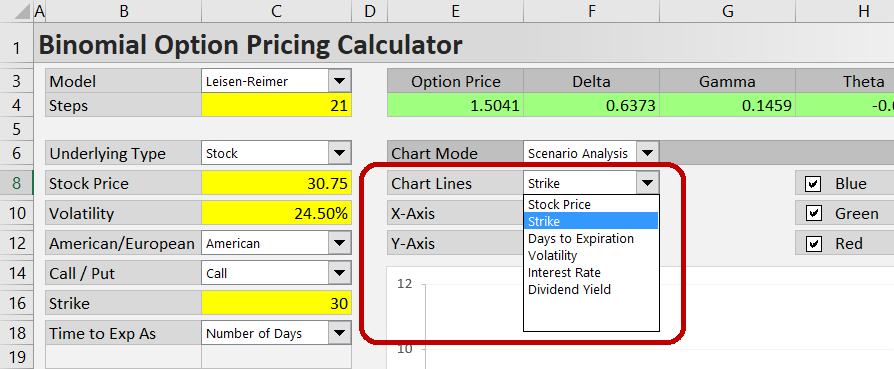
In the Chart Lines dropdown box (cell F8), select the input that will be different between scenarios. For example, when you want to compare different strikes, select "Strike". When you want to model how an option will behave under different volatility scenarios, select "Volatility".
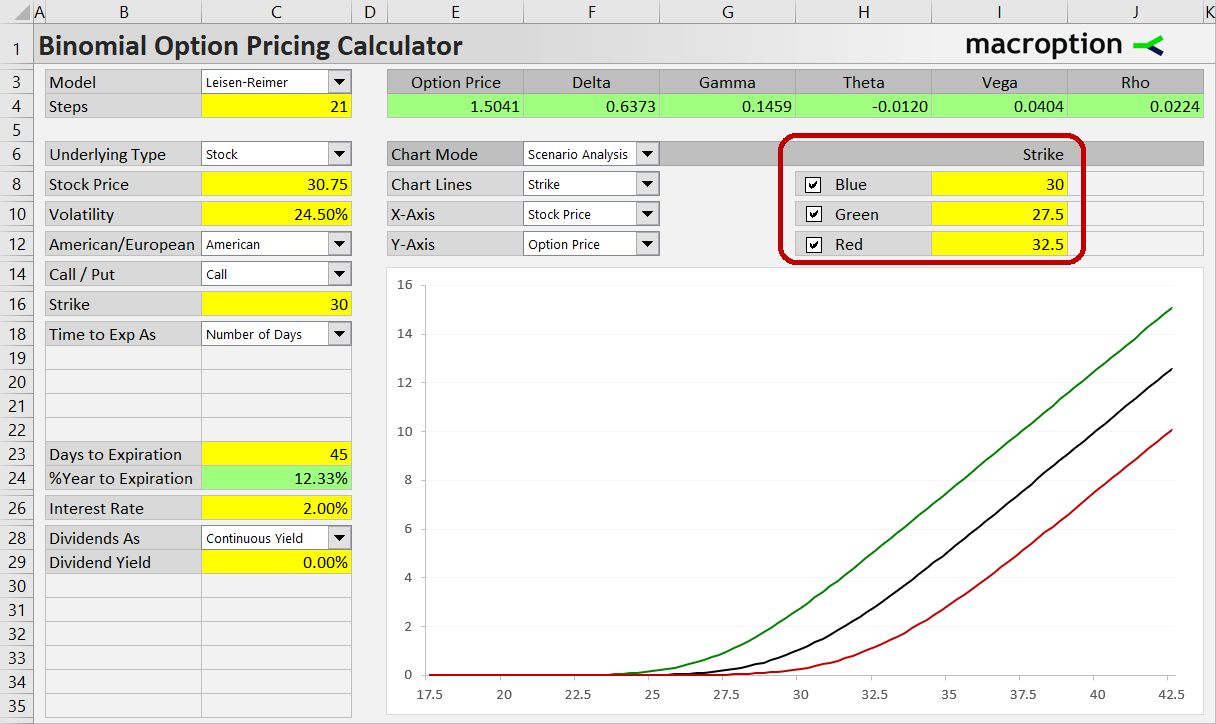
The selected input for each scenario is set in the yellow cells I8, I10, I12.
If the Chart Lines selection is a date and time input (such as valuation date, expiration date or ex dividend date), you can also set the exact times in cell J8, J10, J12.
Now you have the scenarios set and you can model effects of different factors (X-axis, cell F10) on option prices and Greeks (Y-axis, cell C12) under the different scenarios.
Examples
The example below shows how gamma will change as the stock price moves, depending on which strike you have selected for a trade.
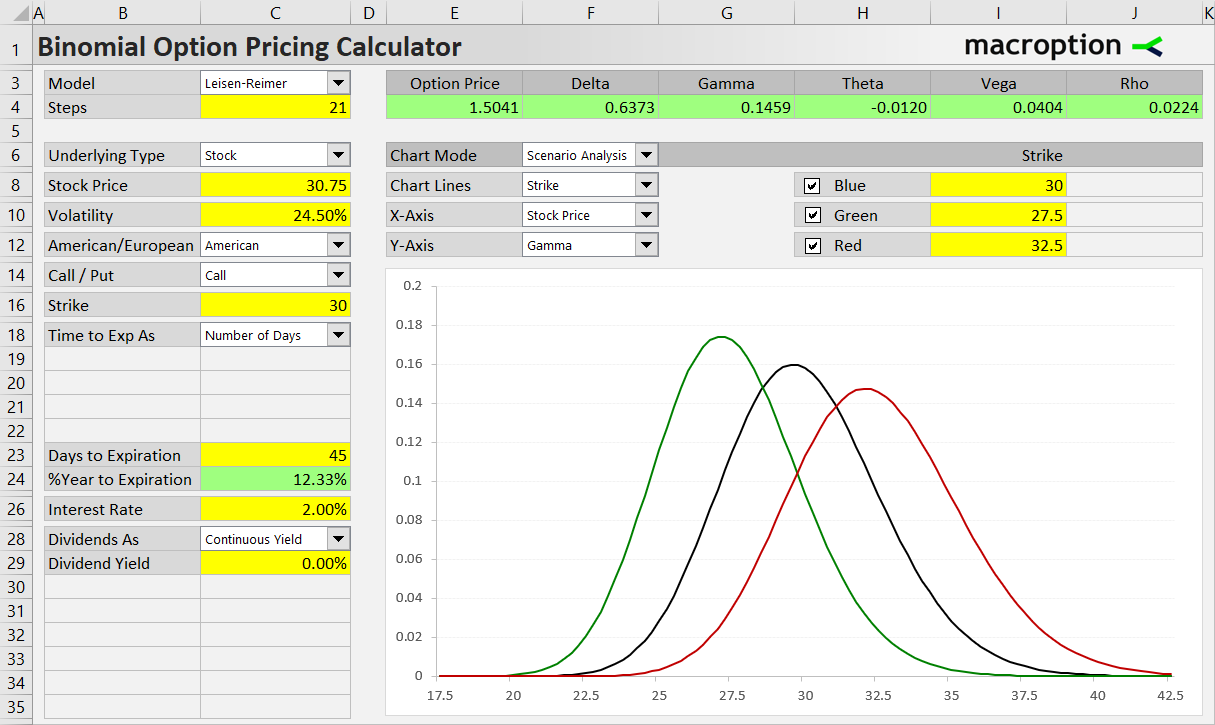
Strike is selected in the Chart Lines dropdown box, Stock Price in the X-axis dropdown box and Gamma in the Y-axis dropdown box. The strikes for individual scenarios – 30, 27.5 and 32.5 – are entered in the yellow cells I8, I10, I12.
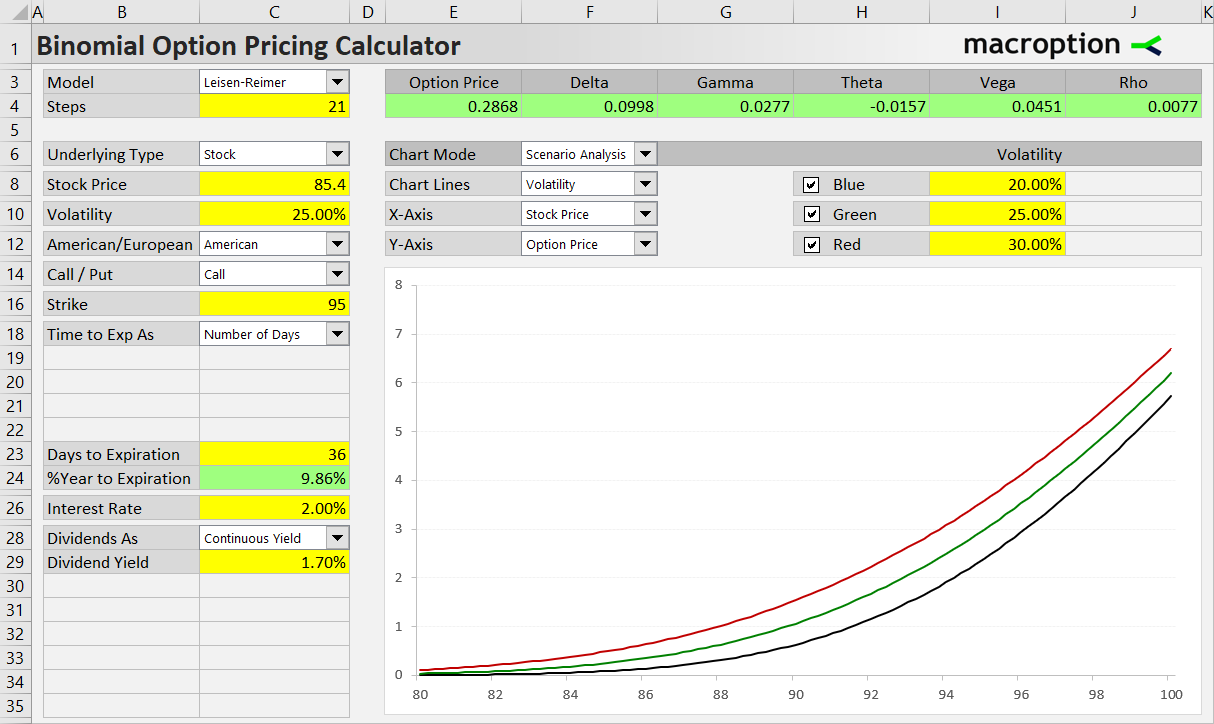
The next example models how a particular option's price will depend on underlying price under different volatility scenarios.
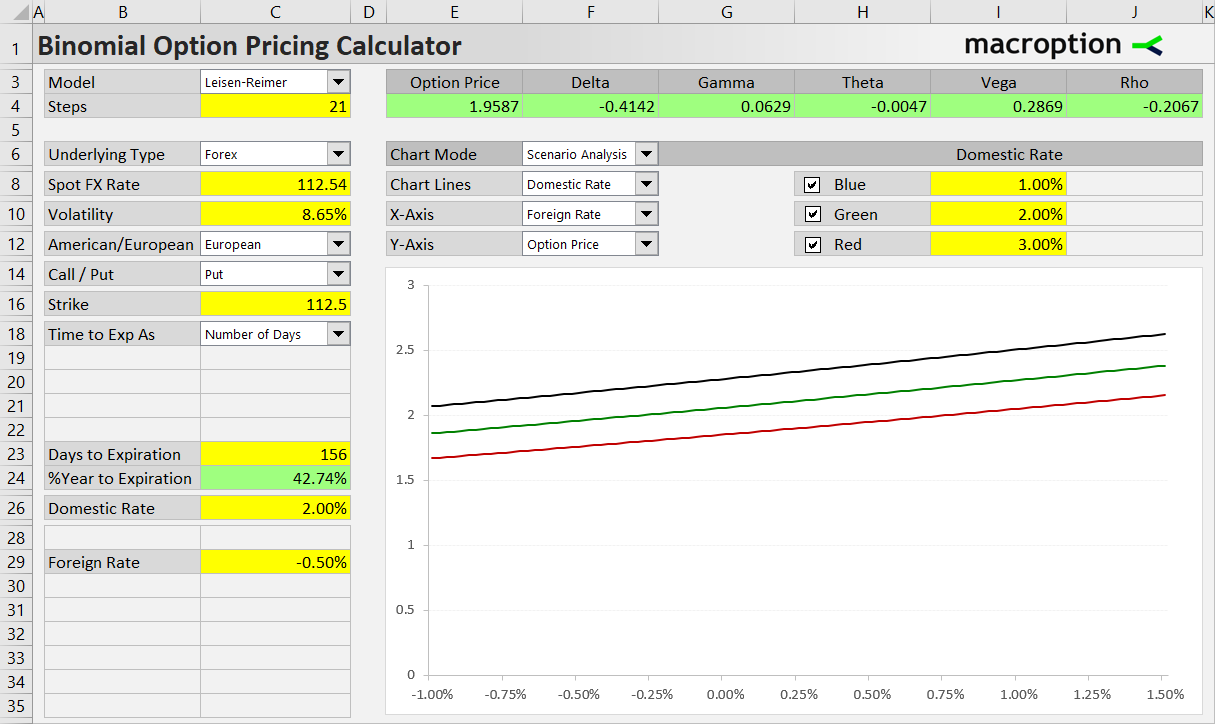
The last example below models the combined effect of the USD and EUR interest rates on a put option on the EUR/USD FX rate. The three scenarios differ in USD rate (1%, 2%, 3%) and the EUR rate is on the X-axis; Y-axis shows option price. (See more details about the specifics of FX options and how to work with them in the calculator.)
Displaying and Hiding Lines
If you want to hide a series (and compare only two scenarios, for instance), you can uncheck one of the checkboxes in cells H8, H10, H12. A series is also hidden when its input (I8, I10, I12) is missing.
In other words, for a line to be displayed in the chart, both these conditions must be met:
- Checkbox must be checked (H8, H10, H12)
- Input must not be empty (I8, I10, I12)
Viewing Exact Values
Sometimes you may want to see the exact X or Y values for different points in the chart. You can find them the in the ChartData sheet.
The X-axis values are in cells P9-P101.
The Y-axis values for the three scenarios are in cells Q9-Q109, R9-R109 and S9-S109, respectively.
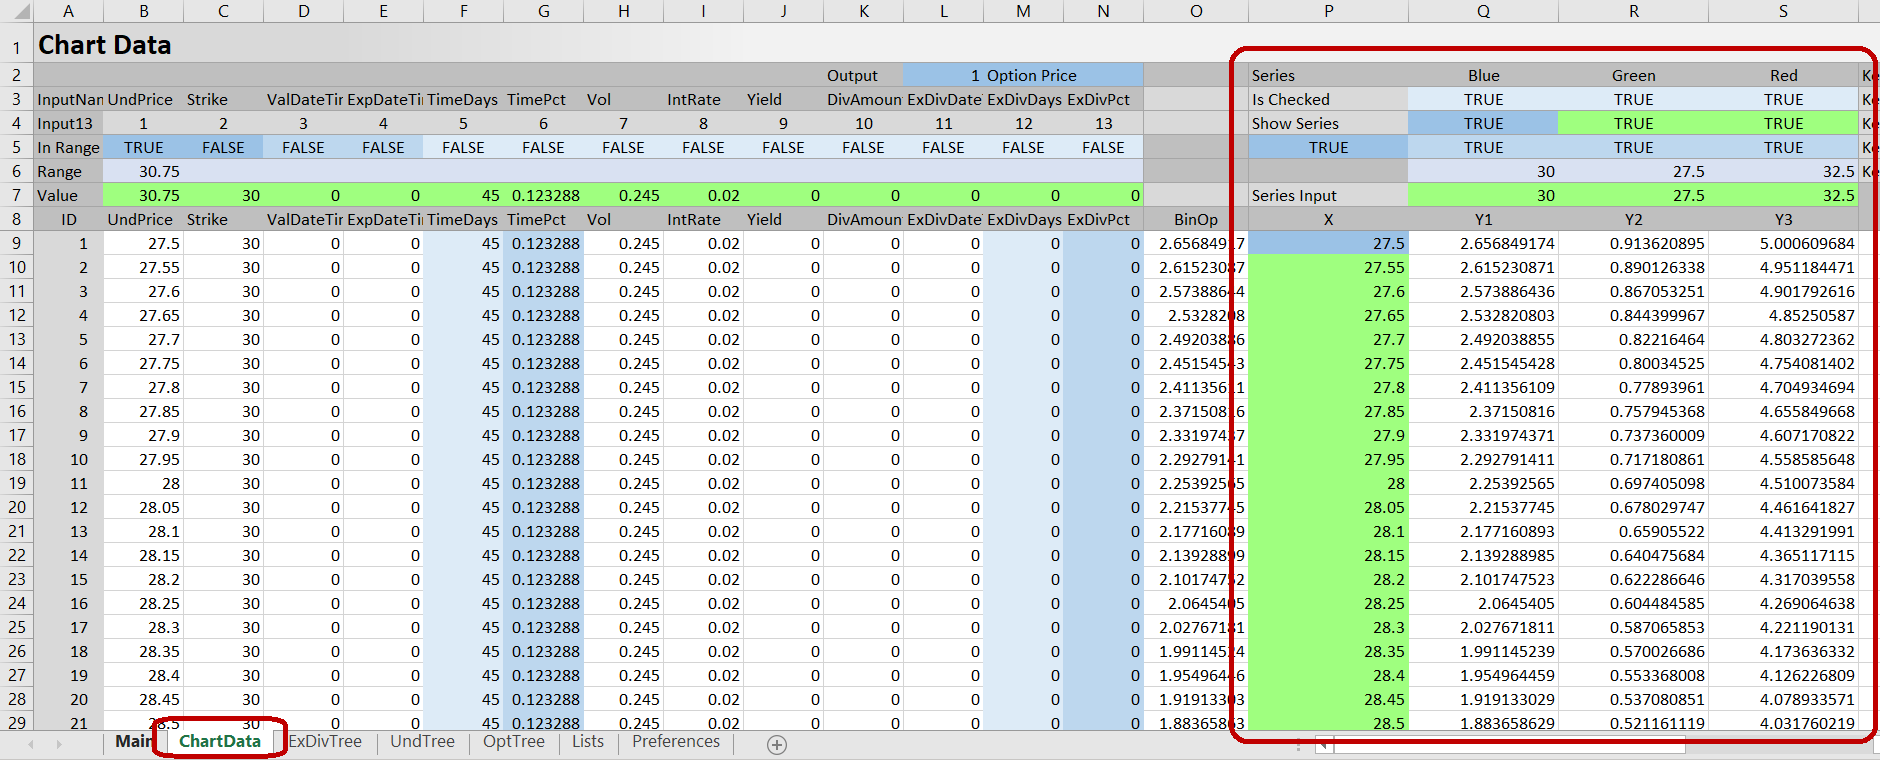
Columns B to N in ChartData show the inputs used for calculating each chart point (inputs for the second and third series are below the first in rows 111-211 and 213-313, respectively).
There are 100 increments on each chart line, connecting 101 points. Sometimes you will see part of a line missing (the Y-axis values in ChartData will show #N/A!). This is intended; it happens when the combination of inputs at the particular chart point does not allow construction of binomial trees and calculation of the desired output (option price or Greek).