This page explains short straddle profit and loss at expiration and the calculation of its break-even points.
Short Straddle Basic Characteristics
Short straddle is non-directional short volatility strategy. It is composed of a short call option and a short put option, both with the same strike price and expiration date - which is the inverse of long straddle (long call + long put).
Short straddle has limited potential profit, equal to the premium received for selling both legs, and unlimited risk. As a short volatility strategy it gains when the underlying doesn't move much and it loses money as the underlying price moves further away from the strike price to either side.
We will illustrate the profit and loss profile and the various scenarios on an example.
Short Straddle Example
We will use the same options that we have used in the long straddle example - the only difference is that now we are selling them rather than buying. A short straddle position is the exact other side of a long straddle trade.
Let's set up our short straddle with the following two transactions:
- Sell a $45 strike put option for $2.85 per share.
- Sell a $45 strike call option with the same expiration date for $2.88 per share.
Like with a long straddle, the strike closest to the current underlying price is typically selected, unless the trader has a directional bias.
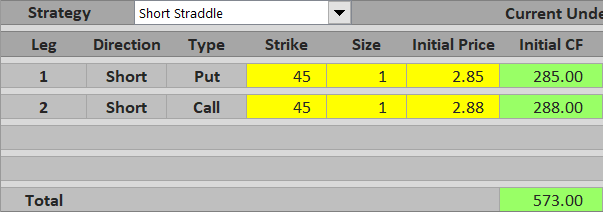
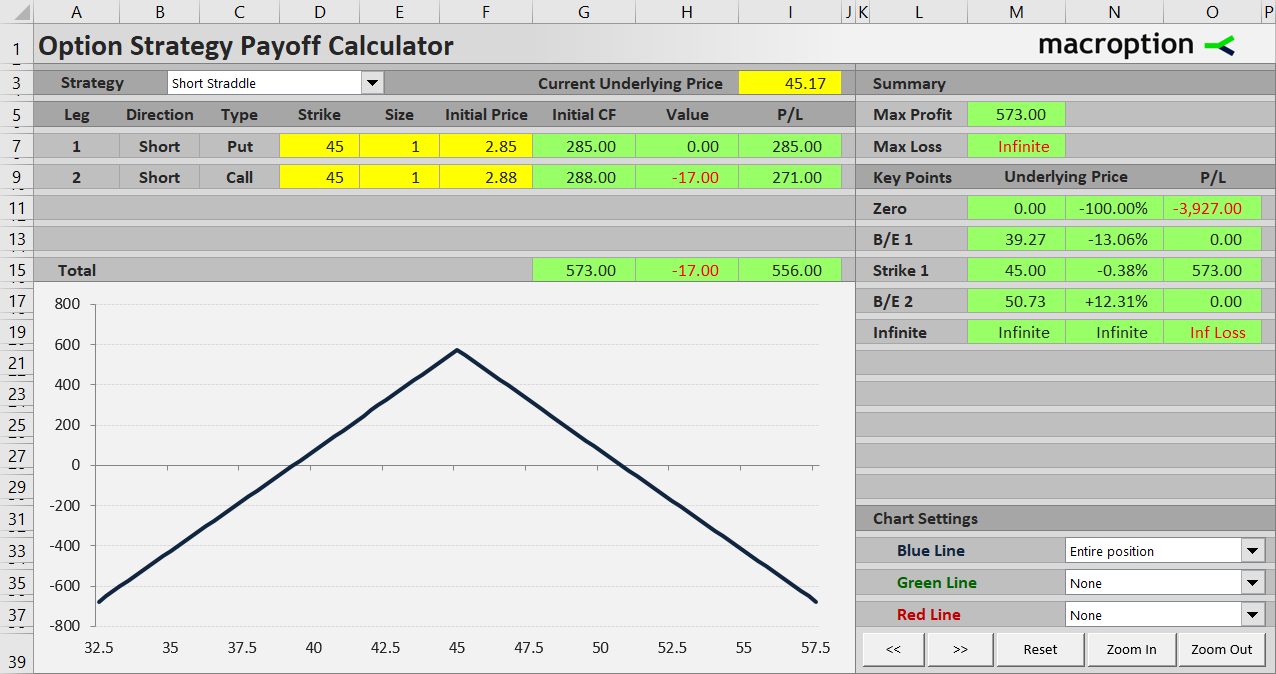
Initial cash flow from this trade, assuming one contract for each leg, is $285 received for the put plus $288 received for the call, which is $573 in total. More generally:
Initial cash flow = put premium received + call premium received
Maximum Profit
Because we are short both options, there is no way to earn more than the premium received in the beginning - it can only get worse. The objective of a short straddle trade is to defend the premium received.
Because the call and the put have the same strike price, as soon as the underlying price moves a cent away from that strike, one of the options will have positive intrinsic value - which is our loss, as we are short.
The best case scenario is that underlying price ends up exactly at the strike price at expiration. In such case both the options expire worthless, there are no additional losses from option assignments, and the trade's total profit equals the initial cash flow, or $573 in our example.

Maximum profit from a short straddle equals premium received. It applies only when underlying price ends up exactly at the strike price at expiration.
If Underlying Goes Up
If underlying price ends up above the strike at expiration, the short call is in the money and total profit declines as underlying price rises.
For example, with the underlying at $48.50, the call option's value at expiration is $48.50 - $45 = $3.50 per share = $350 for one contract. This is more than premium received for the option in the beginning ($288), so the call alone makes a loss of $62. However, the put is out of the money and by itself makes a profit equal to premium received for it, or $285. Combining the two legs, the short straddle makes a profit of $223.

If underlying price end up much further above the strike, the call option's value exceeds premium received for both options and the trade's total P/L turns to a loss. For example, with underlying price at $57 the call option's value is $1,200 and total P/L is $573 - $1,200 = - $627, a loss.

When underlying price ends up above the strike at expiration, total P/L declines as underlying price rises and equals the difference between premium received for both options and the call option's value.
P/L above the strike = premium received - call value
P/L above the strike = premium received - (underlying price - strike)
If Underlying Goes Down
The same logic applies when underlying price ends up below the strike price, only the contributions of the two legs are reversed. The call is out of the money and expires worthless. The put is in the money and the further below the strike, the higher its value and the lower the total P/L.
For example, with underlying price at $41, the put option's value is $400, which is still less than premium received for both options, therefore total P/L is a profit of $573 - $400 = $173.

If underlying price drop to $32, the short put's value is $1,300 and total P/L is a loss of $573 - $1,300 = - $727.
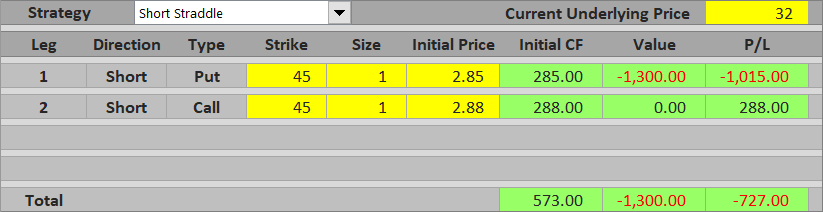
When underlying price ends up below the strike at expiration, total P/L decreases proportionally to underlying price and equals the difference between premium received for both options and the put option's value.
P/L below the strike = premium received - put value
P/L below the strike = premium received - (strike - underlying price)
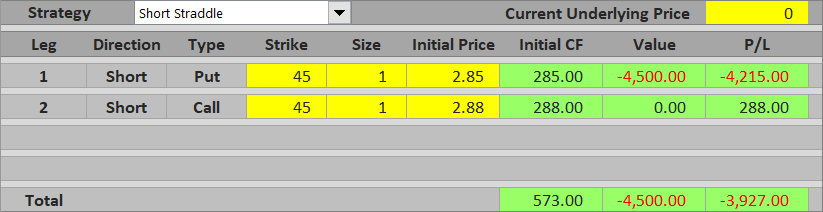
Maximum Loss below the Strike
While potential loss is unlimited above the strike, as for most underlyings there is no theoretical limit on how high their prices can go, below the strike underlying price typically can't get below zero. As a result, maximum possible loss below the strike is limited, although usually very large.
Maximum loss below the strike = strike - premium received
In our example, it is $45 - $5.73 = $39.27 per share = $3,927 per contract.
Short Straddle Break-Even Points
When considering a potential short straddle trade, it is useful to know where exactly the total P/L turns from profit to loss and how wide the profit window is. There are two break-even points - one above the strike and one below. Their distance from the strike is the same and equal to premium received for both options.
B/E #1 = strike - premium received
B/E #2 = strike + premium received
In our example:
B/E #1 = $45 - $5.73 = $39.27
B/E #2 = $45 + $5.73 = $50.73
You can see that the lower break-even price is equal to maximum possible loss on the downside.
If you have seen the long straddle payoff tutorial, you can also see the break-even points are exactly the same. This is not surprising, as long straddle and short straddle are just the other side of one another.
Short Straddle Payoff Summary
Below you can find a short straddle payoff diagram (blue line) and contributions of individual legs - the short call (red) and the short put (green).
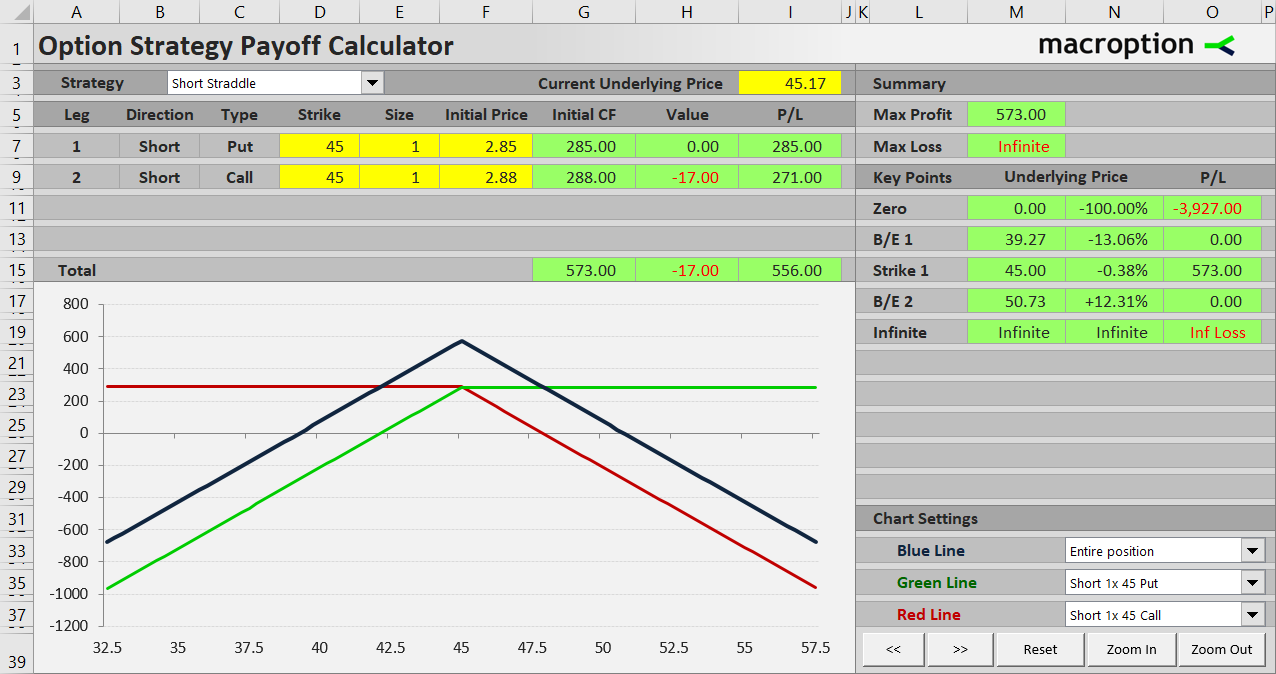
Maximum profit is exactly at the strike ($45).
Below the strike P/L declines proportionally to underlying price, thanks to the rising value of the short put.
Above the strike P/L decreases as underlying price grows, thanks to the rising value of the short call.
Similar Option Strategies
We already know that short straddle is the other side of long straddle, which is a non-directional long volatility strategy.
Short straddle payoff is similar to short strangle. The difference is that in a short strangle the call strike is higher than the put strike and as a result maximum profit applies for any underlying price between the two strikes. Other things being equal, maximum profit of a short strangle is smaller than maximum profit of a short straddle, because the options you sell are typically out of the money. Nevertheless, thanks to the gap between strikes, the window of profit between the two break-even points is actually wider with a short strangle, making it a slightly more conservative trade than a short straddle.
With the above said, both short straddle and short strangle are quite risky trades. When not carefully managed they can result in large losses if underlying price makes a big move. To limit the potential losses, you can buy an out of the money call and an out of the money put as hedging. This will reduce net premium received and thereby maximum profit, but it will also protect you from large moves. This strategy (short straddle hedged with a lower strike long put and a higher strike long call) is known as iron butterfly. In the same way, iron condor is a hedged version of short strangle.