This is part 5 of the Option Payoff Excel Tutorial, which will demonstrate how to draw an option strategy payoff diagram in Excel.
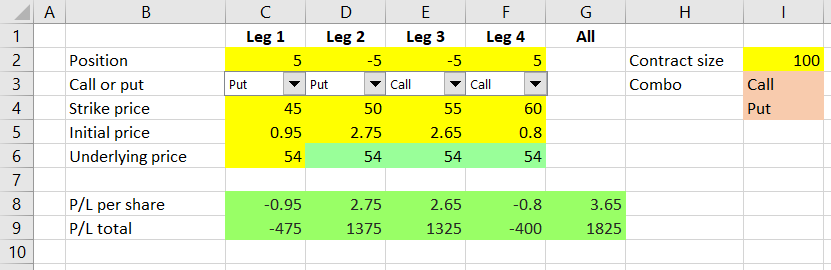
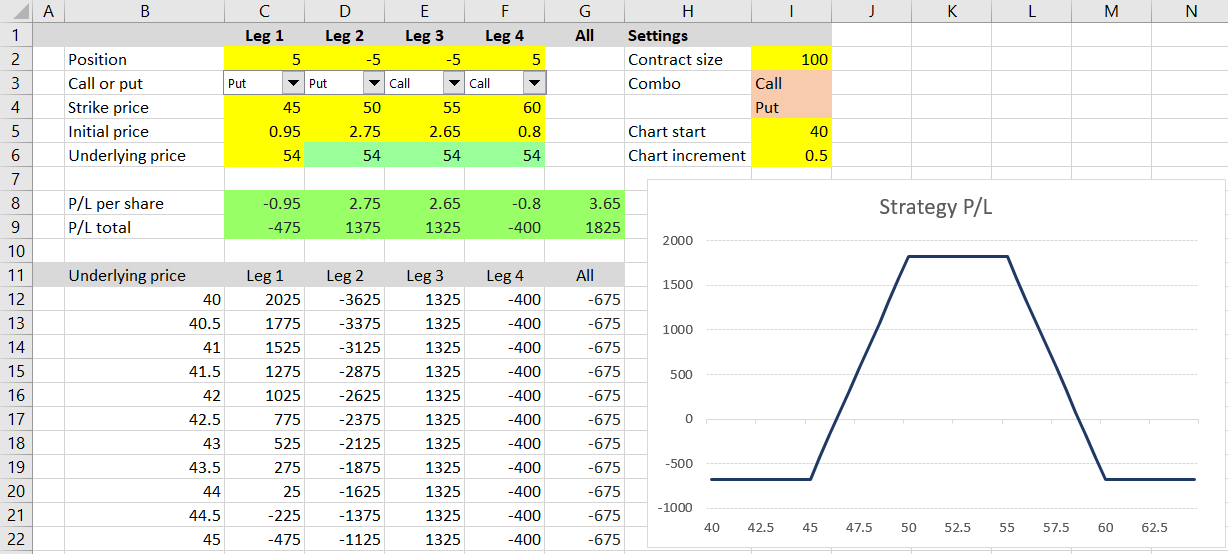
In the previous four parts we have explained option profit or loss calculations and created a spreadsheet that calculates aggregate P/L for option strategies involving up to four legs. For example, the screenshot below shows an iron condor made on strikes 45/50/55/60 with 5 contracts each.
We will use these calculations to create a payoff diagram, which is a graph that shows how an option strategy's profit or loss (P/L) changes based on underlying price.
To draw the graph, we need to calculate P/L for different levels of underlying price. We will do this right below our existing P/L calculations.
Let's put underlying price (the chart's X-axis) in column B, starting in row 12. In columns C-G we will calculate P/L for the individual legs and for the entire position, just as we do in row 9, but this time we will use the different underlying prices from column B.
Underlying Price Range
One decision we need to make is the range of underlying prices that our payoff diagram will cover.
To make our spreadsheet good for different underlying securities with different price levels, we should make the range dynamic. For example, for options on a stock trading at $15 it would probably be enough to display a range from 0 to, let's say, 30, but for another stock trading in the triple digits we will need a much wider range.
We will make the underlying price range easy to change by setting up two cells for user input - chart start in cell I5 and chart increment in cell I6, as the screenshot below shows.
Cell B12, which will be the first point on the chart's X-axis, will be set equal to cell I5:
=$I$5Cell B13, which will be the second point on the chart's X-axis, will equal the first point plus the increment. The formula in cell B13 is:
=B12+$I$6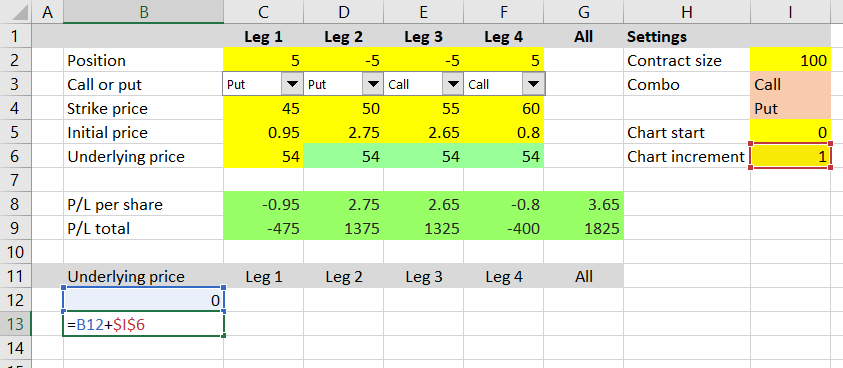
Make sure to use relative reference for the first point (B12) and absolute reference for the increment ($I$6). This will enable us to copy the formula from cell B13 to the cells below it. Each subsequent row will show underlying price higher than the previous one, with the increment set in cell I6.
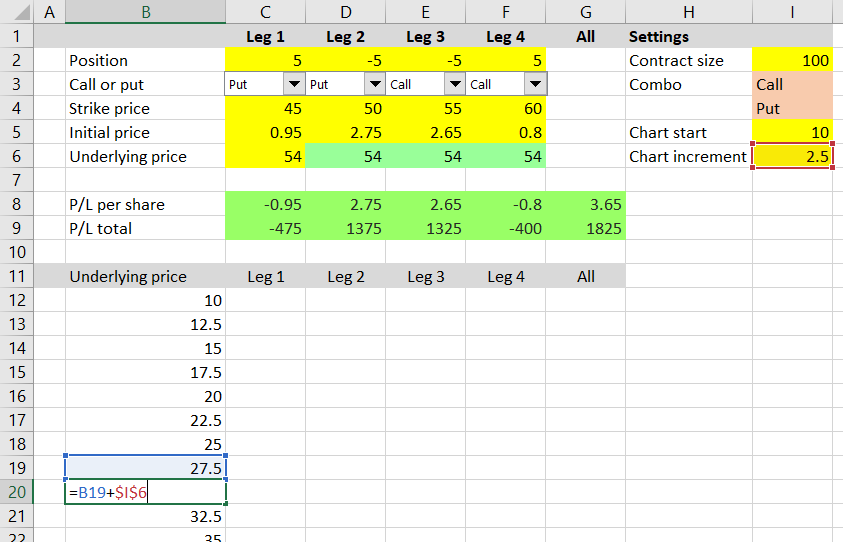
Copy cell B13 to the 48 following rows - cells B14 to B61. Then test your formulas by changing the chart settings in cells I5-I6 and make sure column B is showing the underlying prices that you expect. For example, this is chart start set to 10 and increment set to 2.5:
P/L at Different Underlying Prices
Now we have X-axis ready and can calculate the payoff at each point. The formulas in all rows will be the same - we will create them in the first row (row 12) and then copy them to the other rows.
We can use the formulas which we already have in rows 8 and 9, but will have to make a few adjustments.
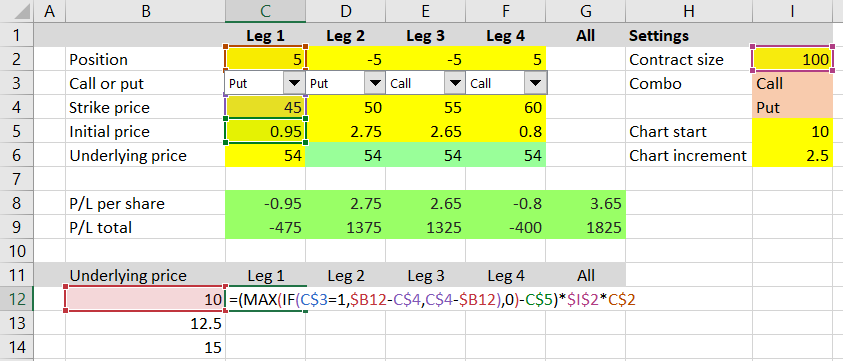
The formula in cell C12 (P/L of leg 1 for the first point on the X-axis) is:
=(MAX(IF(C$3=1,$B12-C$4,C$4-$B12),0)-C$5)*$I$2*C$2You can see that it is almost like the formula we already have in cell C8:
=(MAX(IF(C3=1,C6-C4,C4-C6),0)-C5)*SIGN(C2)... only with the following differences:
- C6 is replaced with B12, because this time we won't be using the underlying price set in row 6, but the changing underlying price in column B, which will be different for different points on the chart. Notice the dollar sign (absolute reference) before the B, but no dollar sign (relative reference) before the 12. When we copy the formula to other cells, this will make the formulas in the other columns (C, D, E) still point to column B, but each row will use its own underlying price input.
- For similar reasons, we must adjust the references to cells C3, C4, C5 and place dollar signs this time before the row number, but not before the column letter. This is because the formulas in all the subsequent rows should use the same call/put, strike price and initial price inputs (from rows 3, 4, 5), but the formulas in the other columns (D, E, F) should use the inputs from the particular column (D3, D4, D5 for the formula in column D etc.). Change the references to
C$3,C$4,C$5. - At the end of the formula, remove
SIGN(C2)- the +1 or -1 for long or short position - and add$I$2*C$2, which besides the direction also contains number of shares and contract size. It is just like the end of the formula in cell C9, but this time without the ABS, because we also need the direction. Make sure you get the dollar signs right.
Now we can copy the formula that we have created in cell C12 to all other cells in the C12-F61 range. For each of the four legs, we have calculated profit or loss for all 50 points on the chart's X-axis.
To calculate total P/L for the entire position at each point, copy the formula from cell G9 (sum of the four legs' P/L) to cells G12-G61 (no adjustments needed in this case).
Creating the Payoff Chart
Now we can just create a standard line chart with values range G12-G61 and labels range B12-B61. It will show the payoff diagram for our strategy. We can control the underlying price range (effectively zoom in or out) by changing the chart settings in cells I5-I6.
We can also display payoff diagrams for individual legs - in such case the chart series value range will be C12-C61, D12-D61 etc., but labels range is always the same: B12-B61.
Next Steps
There is of course much to improve in terms of layout and visual design. For example, you can change the colors or locations of different parts to adjust the spreadsheet to your preferences, you can make the chart bigger and more prominent etc. We will briefly discuss these improvements in the final part of the tutorial, but before we get to that, let's add some more useful features.
In the next two parts of the tutorial, we will look at the calculation of maximum profit, maximum loss and risk-reward ratio.
Go to next part: Calculating Option Strategy Maximum Profit and Loss