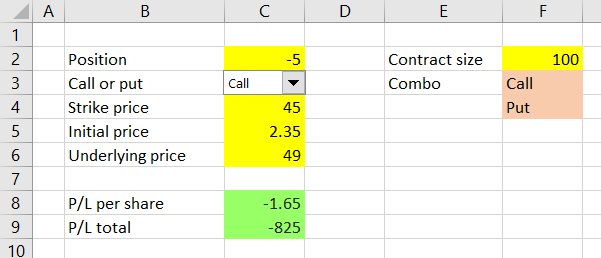
This is part 4 of the Option Payoff Excel Tutorial. In the previous parts (first, second, third) we have created a spreadsheet that calculates profit or loss for a single call or put option, given the strike price, initial option price and underlying price.
Now we are going to expand it to also work with positions involving multiple options - strategies such as straddles, condors, butterflies or spreads.
Option Strategy Payoff Calculation
Total profit or loss from an option strategy that involves multiple options (also called legs) equals the sum of profit or loss of all these individual legs.
Knowing this will be very helpful when creating our option strategy payoff calculator. We can simply create multiple copies of the single option calculation that we already have and then sum up the results to get total strategy P/L.
We will do that by expanding our existing spreadsheet and copying the inputs and formulas from column C to three other columns - D, E, F - to get a total of four possible legs for our option strategies.
Inserting New Columns
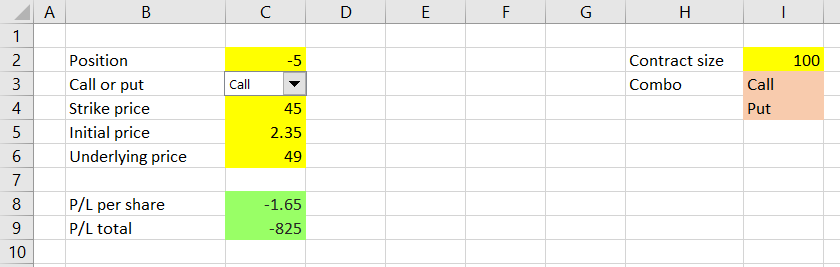
Because columns E-F are currently occupied by the contract size input and the dropdown box text inputs, we must move these to the right to make space for the new legs.
Do this by inserting three more columns before E rather than by copying and pasting the cells - this way you won't break the cell references in the dropdown box and the formula in cell C9. You can insert a new column right before the existing column E by right clicking the label of column E and then selecting Insert from the menu that pops up.
Do this three times to insert three columns. The contract size input and dropdown box data have shifted to columns H-I.
Copying Leg Inputs and Calculations
Now we can copy the entire column C to columns D, E, F. If your Call/Put dropdown box is located right over cell C3 and you do the copying separately (C to D, C to E, C to F - not C to D-F), it will also be copied. The result should look like this:
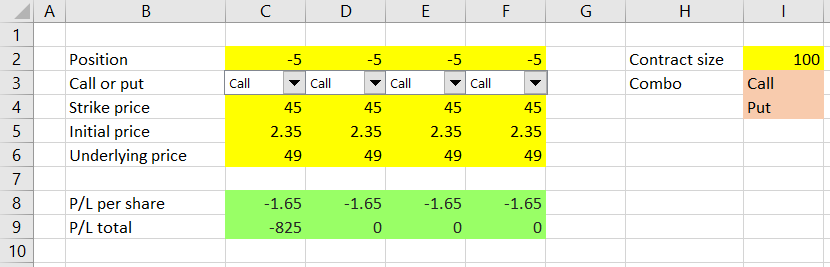
You may notice that the P/L in cells D9, E9, F9 is showing different result than the original cell C9, although all the legs currently have exactly the same inputs and should therefore be showing identical results. There is one thing we need to fix in the P/L formula.
In cell C9, the original formula is:
=C8*I2*ABS(C2)(see the previous part for how we came to this formula)
We must change the I2 part to absolute reference, so the copied cells in columns D, E, F still point to cell I2 (the contract size input, which is the same for all legs).
On the contrary, we will keep the references to C8 and C2 relative, because these (P/L per share and position size) are leg-specific and should therefore change to D8 and D2, E8 and E2, F8 and F2, respectively, for columns D, E, F.
I assume most readers are familiar with the difference between absolute and relative cell references - if not Google has plenty of good explanations.
If you click on the I2 part of the formula in cell C9 and press the F4 key on your keyboard, the I2 cell reference will change from relative to absolute, which you will recognize by the dollar signs:
=C8*$I$2*ABS(C2)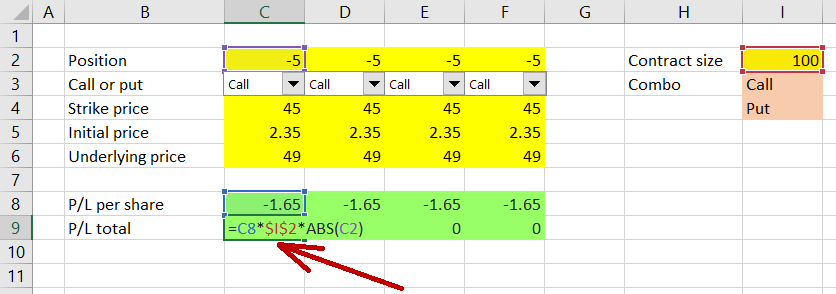
Now you can copy cell C9 to cells D9, E9 and F9 and all these will show correct results for the individual legs.
Fixing the Dropdown Boxes
One last thing which requires a little fixing is the new dropdown boxes in cells D3, E3, F3. We must make sure each of them controls the correct leg, which quite likely is not the case at the moment.
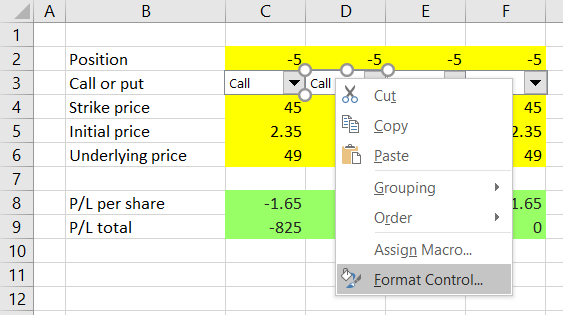
Right click the combo box in cell D3 and then choose "Format Control" (same as we did in part 2 when we were creating the first dropdown box).
In the Format Control window that pops up, check "Cell link" (the middle of the three settings).
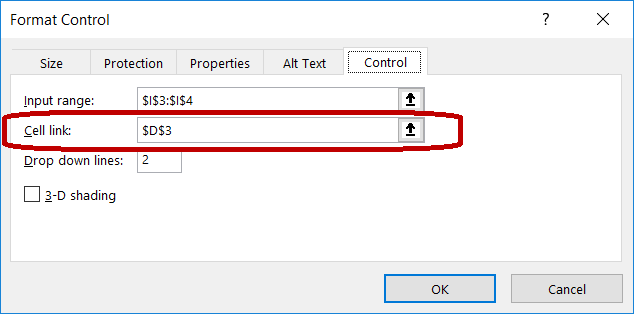
For the dropdown box in column D it should be D3, or $D$3. If it is $C$3 or anything else, change it. This setting decides where the combo box selection will be stored, which of course must match the particular leg, otherwise your combo box would control a wrong leg and the calculations would be incorrect.
Repeat this with the dropdown boxes in E3 and F3.
Now all the individual legs should have correct calculations - test this by changing the different inputs and combo box selections.
Calculating Total Strategy P/L
The last step is to calculate total payoff for the entire position, which is just sum of the four legs. We can calculate it in cell G9, using the formula:
=SUM(C9:F9)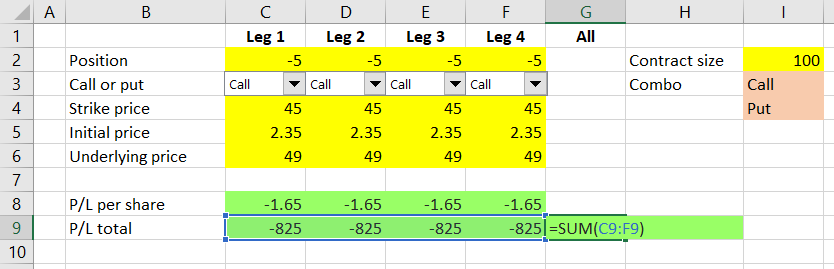
Now cell G9 shows aggregate profit or loss for our entire position - the sum of the individual legs' P/L totals.
We can also do the same with row 8 and calculate aggregate P/L per share, but note that in some cases (for positions where the number of contracts is not the same for all legs) this number might not make much sense.
Fixing Underlying Price Input
There is one very last change, which won't affect the calculations but will make the spreadsheet a little more user-friendly. At the moment each column has its own underlying price input (row 6), but this input will always be the same for all legs. Therefore it's more practical for the user to only change it in one place.
You can change the hard typed values (currently 49) in cells D6, E6, F6 to a formula linking to cell C6 and perhaps make the cells green as a reminder that these should not be changed:
=$C6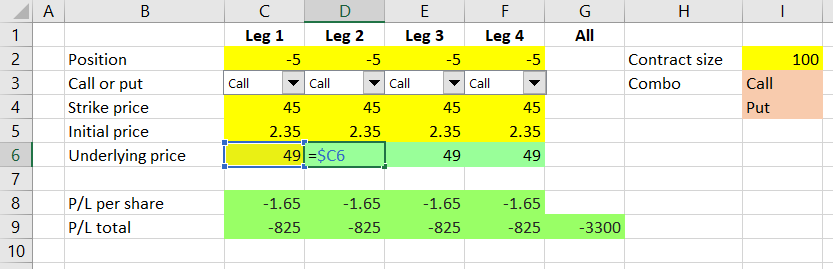
Now underlying price, same for all legs, will be changed in cell C6 only.
Alternatively, you can move the underlying price input somewhere else (like we did with contract size in cell I2); in such case you will also need to update the formulas in cells C8-F8 to reflect its new location.
Strategies with Fewer than Four Legs
While we have four legs in our spreadsheet, this does not mean we can't use it for strategies with only two or three legs, or even single option positions. Just set the position (cells C2-F2) to zero for any unused legs (as a result, rows 8 and 9 in these columns should also be showing zero).
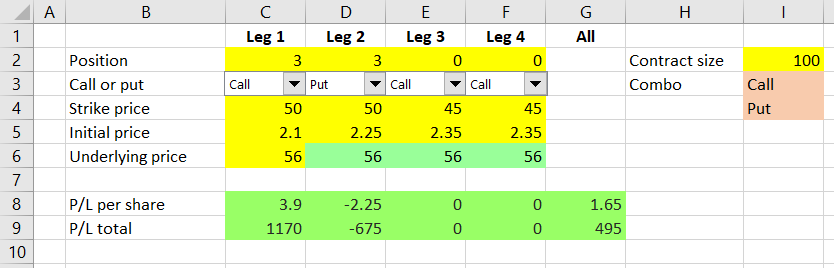
For example, the screenshot above shows P/L of a long straddle position, using 3 contracts each of long call and long put, both with strike $50, purchased at $2.10 and $2.25, respectively. When the underlying is at $56, total P/L for the entire strategy is $495. The calls are in the money and make a profit of $1,170, while the puts are out of the money and their loss equals the initial cost, or $675.
Next Steps
Having started with a very simple calculation in part one, now in part 4 we have created quite an advanced spreadsheet which can calculate profit or loss for any combination of up to four legs and can be used to model a wide range of option strategies. You could see that expanding the spreadsheet from single option to four legs was really just a matter of creating additional copies of the same column, but there were a number of small details which we had to check and fix, in order to make sure our calculations are correct.
In the next part, we will use our calculations to draw payoff diagrams for our strategies.