This page explains bull put spread payoff at expiration and the calculation of its maximum profit, maximum loss, break-even point and risk-reward ratio.
Bull Put Spread Basic Characteristics
Bull put spread, also known as short put spread, is a position created with two put options:
- Buying a put with lower strike.
- Selling a put with higher strike and same expiration.
It is actually the other side of a bear put spread trade, where a higher strike put is bought and a lower strike put is sold. As a result, the profit and loss profile is also inverse. While bear put spread is a bearish strategy, bull put spread as its name suggests is bullish - profits when the underlying security goes up. Like other vertical spreads, a bull put spread has limited risk and limited profit potential.
Unlike bear put spread and unlike bull call spread (which is also bullish and has a similar payoff profile), bull put spread is a credit spread, which means the cash flow when opening the position is positive. This is because the higher strike put that you sell is typically more expensive than the lower strike put that you buy. However, the trade typically comes with margin requirement.
The objective of a bull put spread trade, as with other credit spreads, is to defend the premium that you have received. In an ideal case, the underlying price goes up and ends up above both the put options' strikes at expiration, making both the options worthless - the overall outcome of the trade is therefore the initial cash received. The worst case scenario is that underlying price ends up below both strikes, resulting in a loss that corresponds to the difference between the two strikes, less premium received.
Let's illustrate the profit and loss profile on an example.
Bull Put Spread Example
Consider a position made up of two legs (options):
Buy a $45 strike put option for $1.87 per share, or $187 total cost (assuming 100 shares per contract as for standard US equity options).
Sell a $50 strike put for $4.49 per share, or $449 total cash inflow.
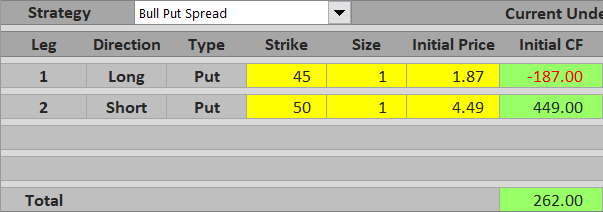
Initial cash flow is therefore $449 - $187 = $262, net positive.
Note that this is exactly the other side of the trade we have used for the bear put spread example. This time, we want the underlying price to increase and both the put options to get out of the money. If we hold the position until expiration, there are three possible scenarios.
Scenario 1 (Maximum Loss)
The worst case scenario is that we are wrong and the underlying price goes down, getting below both options' strikes at expiration (for example $42). Both options are in the money. You will be assigned the higher strike put and lose $50 - $42 = $8 per share, or $800 for one option contract. However, the lower strike put which you have bought acts as a hedge and limits the loss. It is in the money by $3 per share ($45 - $42) and reduces the loss by $300. In total, you lose $500 at expiration (the difference between the two strikes = $5 per share), but you have received $262 in the beginning, so the total loss is $238. Again, note that this trade's maximum loss scenario is the same as the maximum profit scenario from the bear put spread example, just inverse.

Maximum loss from a bull put spread trade is equal to difference between strikes minus net premium received. It applies when underlying price ends up at or below the lower strike.
Scenario 2 (Maximum Profit)
The best case scenario is again the inverse of the worst case scenario from the bear put spread example. If underlying price ends up above the higher strike, both options expire worthless and there is zero cash flow at expiration. You still keep the premium received when opening the position ($262), which is the maximum possible profit from this trade.

Maximum profit from a bull put spread is equal to premium received in the beginning. It applies when underlying price ends up above the higher strike and both options expire worthless.
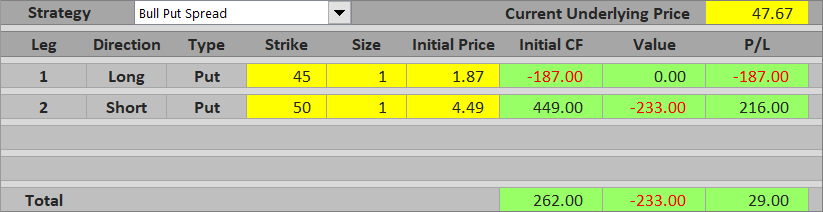
Scenario 3 (Between the Strikes)
If underlying price ends up between the two strikes, only the short higher strike put has some value at expiration. Total profit or loss from the trade is therefore equal to the difference between premium received in the beginning and the higher strike put option's value at expiration. For example, with underlying price at $47.67, the higher strike put is worth $50 - $47.67 = $2.33 per share = $233. This is less than premium received ($262), therefore total result is positive $29, a small profit.
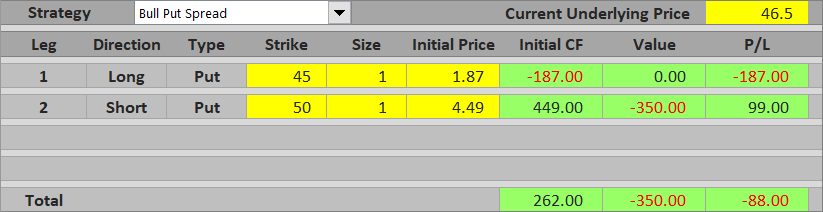
If the underlying drops further to let's say $46.50, the higher strike put is now worth $50 - $46.50 = $3.50 per share = $350, which exceeds the premium received in the beginning and turns the trade into a loss.
Profit or loss between the two strikes increases as underlying price goes up. Near the lower strike it approaches maximum loss; near the higher strike it approaches maximum profit.
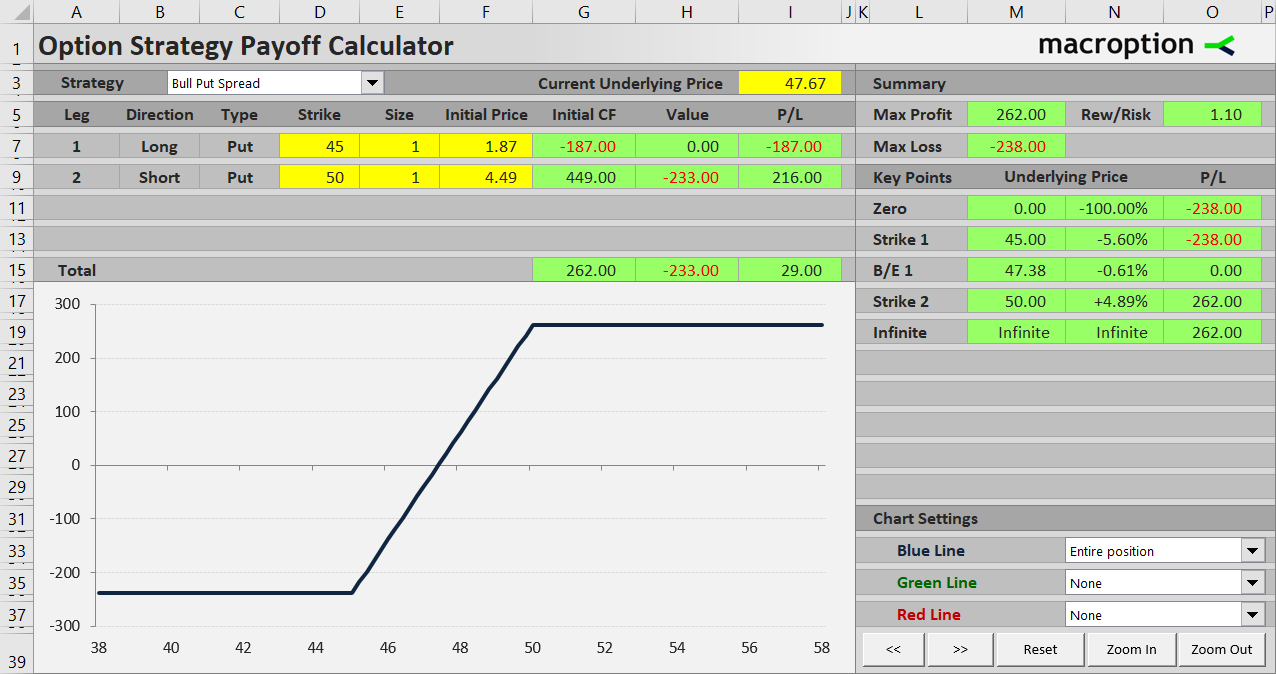
Bull Put Spread Payoff Diagram
You can see the payoff diagram below. The blue line shows overall bull put spread P/L, the green line is the higher strike short put and the red line is the lower strike long put. X axis shows underlying price, Y axis profit or loss.
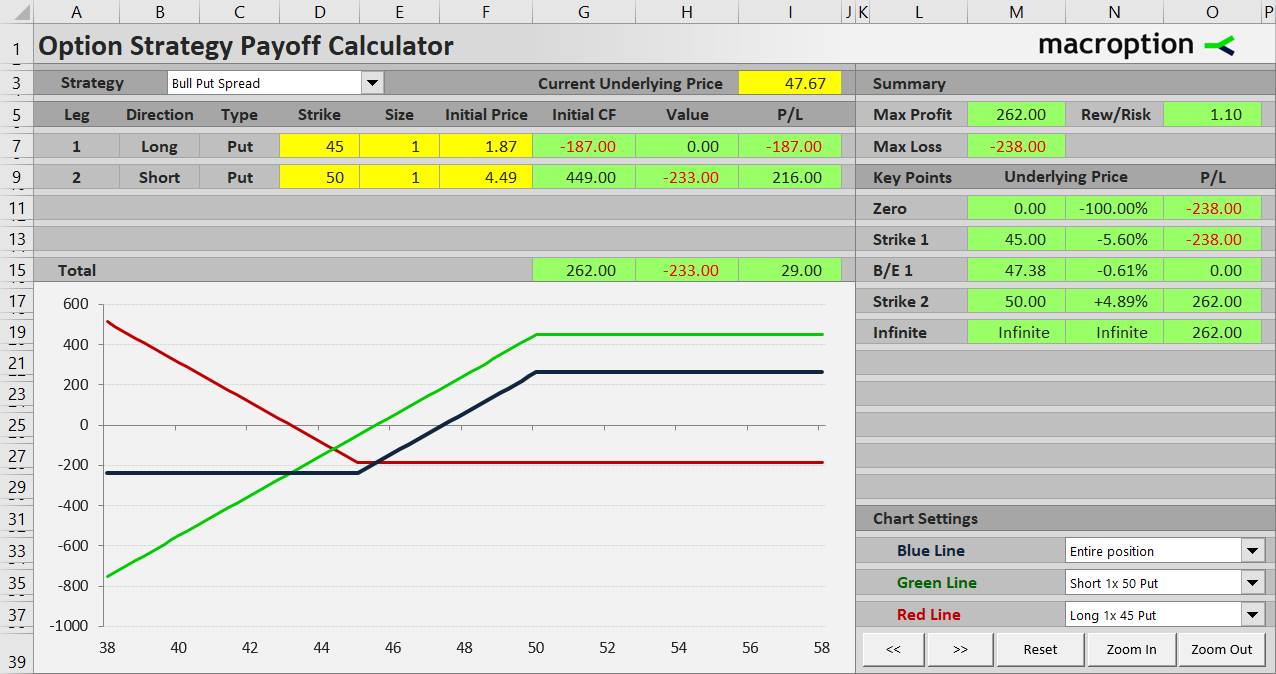
Below $45 both options are in the money, but changes in their values exactly offset one another and total P/L is a constant loss.
Between $45 and $50 the lower strike long put is worthless and total P/L grows as underlying price increases as the higher strike short put declines in value (grows in profit).
Above $50 both options are out of the money and total profit equals initial net premium received.
Bull Put Spread Break-Even Point
Because bull put spread is the other side of bear put spread, break-even price is the same - only profit for one side is loss for the other and vice versa.
In our example, the break-even point is at $47.38, which is when the value of the short higher strike put ($50 - $47.38) exactly equals net premium received ($2.62).
More generally, the formula for bull put spread break-even point is:
B/E = higher strike - net premium received
Bull Put Spread Risk-Reward Ratio
Risk-reward ratio in our example is 1 : 262/238 = 1 : 1.10. In other words, maximum possible profit is about 10% higher than maximum possible loss from the trade.
General formulas for bull put spread risk and reward are as follows:
Maximum profit (reward) = net premium received
Maximum loss (risk) = higher strike - lower strike - net premium received
Maximum loss (risk) = B/E - lower strike
Similar Option Strategies
We have already mentioned that bull put spread is the other side of bear put spread.
It has similar payoff to bull call spread. The main difference is that bull call spread uses calls rather than puts and it is a debit spread (negative cash flow on position entry).
Another strategy with similar payoff profile is collar, which contains a lower strike long put (exactly like in a bull put spread), a long position in the underlying security and a short higher strike call (the combined effect of long underlying and short call is the same as the short higher strike put in a bull put spread).
Bull put spread can be considered a hedged version of short (naked) put. The difference is the lower strike long put, which reduced premium received and therefore reduced profit potential, but protects the position from extreme drops in underlying price. Distance between the two strikes determines how conservative or how risky a bull put spread is - the wider the gap, the more risk. In fact, a plain and simple short put can be considered something like a bull put spread where the lower strike is zero.