This is user manual for the Option Strategy Payoff Calculator.
Use the Right Version
From the download page you can download four different files, for different versions of Excel or other spreadsheet software:
- If you have Excel 2010 or newer, also including Excel for Mac, use the default version, OSPC.xlsm.
- If you have Excel 2007 or older, use OSPC_for_Excel_97-2007.xls.
- For OpenOffice, LibreOffice, Google Sheets, and similar apps which don't support Excel VBA and macros, use the open document format file OSPC_ODF.ods.
- If you have an Excel app on iPad or iPhone, use OSPC_NoVBA.xlsx (the ODF version should also work, but this one is better for iPad or iPhone apps).
The first two (VBA powered) versions work exactly the same; they only differ in small visual details (e.g. colors and chart line design).
The other two versions (ODF, NoVBA) lack dropdown boxes and buttons, as these unfortunately require VBA. This makes some tasks slightly less convenient (e.g. you type in "C" or "P" instead of selecting call or put in a dropdown box), but all calculations work the same.
Enable Calculations and Macros
If you have just downloaded the calculator and opened it for the first time, you may find the dropdown boxes empty and calculations not working.
This is when your Excel opens the file in Protected View or a similar restricted regime where macros and calculations are blocked for security. Usually you will see a notice in place or below your top Excel menu, with a button to "Enable Editing", "Enable Macros" or "Enable Calculations" - the wording varies, depending on your Excel version and settings.

Click that button (in some cases you also need to click another button afterwards to enable another thing) and everything should work normally.
Sheets
There are six sheets:
- Main: Here you set up positions, view P/L and other results, and control and view the payoff diagrams.
- ChartData: Here you can inspect the value and P/L at different underlying price levels for each individual leg and the entire position. Payoff diagrams are drawn using data from this sheet.
- Strategies: Data (each leg option type, direction, order of strikes etc.) for individual strategies which you can select in the dropdown boxes at the top of the Main sheet.
- BgCalc: Items for dropdown boxes, various constants and background calculations (generally nothing of interest to users).
- Preferences: Here you can change settings, such as option contract size (by default 100 as for US equity options) or rounding.
- Help: Version information and useful links.
You can change inputs (yellow cells and dropdown boxes) in the Main sheet and settings (yellow cells) in the Preferences sheet.
The other sheets (ChartData, Strategies, BgCalc) are for viewing only. Do not change anything in these sheets, unless you want to change the way the calculator works, and know what you are doing.
The Yellow vs. Green Cell Rule
As in all other Macroption calculators, cell background color indicates whether it is an input (yellow), formula (green), or label (grey). There is a simple rule:
- You can change the values in yellow cells (in Main and Preferences).
- Do not change green and other cells.
The sheets ChartData, Strategies, and BgCalc also contain cells with other colors. Generally blue (like green) are formulas and red are constants. That said, users should not change cells of any color in these sheets.
Main Sheet Overview
Almost everything important happens in the Main sheet:

- The chart (showing payoff diagrams) is in the middle.
- Above it you can select an option strategy (see Strategy Selection) and specify position size, strikes, initial cost etc. (see Position Controls).
- In the top right corner you can see risk metrics and P/L at important points (see Risk Profile and Break-Even Points).
- On the right you can control the chart (see Payoff Diagrams and Chart Controls).
- In the bottom you can enter a second ("alternative") position and compare it to the default one (see Alternative Position).
Position Controls
The calculator can model any strategy with up to four legs, where each leg can be a long or short position in a call option, put option, or the underlying security. All options must have the same expiration date (otherwise payoff at expiration can't be calculated); so expiration date does not enter the calculations.
For each leg you need four inputs, which are entered in the yellow cells C8-F11.
Position Size and Direction
Position (column C) is number of option contracts (if call or put) or number of shares (if underlying). Negative sign for short position.
Make sure you have set the correct contract sizes for your market (in Preferences sheet):
- Option contract size is number of shares per one option contract. By default it is 100 (as for US stock options).
- Underlying contract size is 1 by default (as 1 share). When working with futures options, you can set this to number of units per one futures contract and then enter underlying position in contracts instead of shares.
Instrument Type
Type (column D) can be call / put / underlying / none. In the default version this is selected from a dropdown box.
In the ODF and NoVBA versions, it is typed in, using the following logic:
- If the first character is "C" (case insensitive), it is a call option (so "c", "C", "call", "Call", "CALL", "call option" all work).
- If "P", it is a put.
- If the cell is empty, it is none (leg not used).
- Anything else (cell not empty and first character not "C" or "P") means the leg is a position in the underlying security.
Strike
Strike (column E) is option strike price, only effective if type is call or put. Keep empty if underlying.
Initial Price
Initial price (column F) is price for which this leg was opened, per share, including commission.
In other words, it is initial cash flow per share, but always with positive sign.
- For a long position, it is the price for which you have bought it, plus commissions, per share.
- For a short position (column C has negative sign), it is the cash received, minus commissions, per share.
You can ignore commissions for simplicity or if you are modeling a hypothetical position.
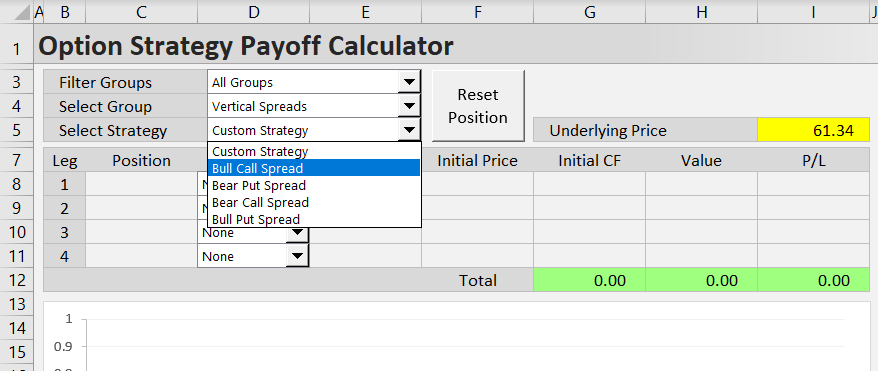
Strategy Selection
Note: This part only applies to the macro-powered Excel versions. Strategy selection dropdowns are not available in the ODF and NoVBA versions (you can still find strategy specifications the Strategies sheet).
In the Main sheet, you can select an option strategy from the dropdown box in cell E5 ("Select Strategy") and the calculator fills the leg inputs with example values.
This has two main uses:
- It speeds up position setup. You get the direction and type set for each leg, and only need to adjust strike and intial price (and possibly position size).
- It helps when you are unsure how a strategy is set up, or when exploring new strategies.
Strategy Groups and Filtering
The calculator contains 66 predefined strategies. Because it may be hard to find a strategy in such long list, you can narrow it down if you are only interested in a particular type of strategies. This is done in the dropdown box in E4 ("Select Group").

For example, you can select a named group like "Vertical Spreads", "Straddles & Strangles", or "Condors & Butterflies". You can also select a group by number of legs (e.g. all strategies with two legs), by underlying direction and volatility exposure (bullish, bearish, long volatility, non-directional), or by risk profile (strategies with limited risk, limited profit, or limited both).
In the same way, you can narrow down the list of available groups using the dropdown box in E3 ("Filter Groups").
Note that this filtering is entirely optional. When the dropdown in E4 is set to "All Strategies" (always the first item), the strategy selection dropdown in E5 will list all the 58 available strategies (just like in the previous versions of the calculator) and you can ignore the dropdowns in E3 and E4.
In fact, you can ignore all the strategy selection dropdowns and always set up positions manually in cells C8-F11. The strategy selection dropdowns do not affect any calculations - their only role is to autofill the position inputs with predefined example values.
Custom Strategy
The above also means that, unlike previous versions, the calculator now allows custom strategies, not limited to the predefined ones.
This is best done by selecting "Custom Strategy", always the first item in the strategy selection dropdown E5. That said, you can create a custom position from any predefined strategy.

Position Reset
When you want to reload the predefined example inputs for the currently selected strategy, click the "Reset Position" button in F3-F5.
Note: When Custom Strategy is selected, you can use the Reset Position button to clear all the position inputs and set all legs to None.
Value and Profit/Loss
When you have the correct position inputs, you can see the initial cash flow, value, and P/L for each individual leg and for the entire position in the green cells G8-I12.

If you see unexpected values, make sure you have the correct option contract size and underlying contract size set in the Preferences sheet.
The values and P/L are for the underlying price set in the yellow cell I5.
Risk Profile and Break-Even Points
On the right (K7-N17), you can see an overview of P/L at all important underlying price levels, such as all strikes and break-even points.

- Column L is the underlying price.
- Column M is precent change from the current underlying price in cell I5.
- Column N is profit or loss.
Above it you can see the summary risk metrics:
- Maximum possible profit is in cell N3.
- Maximum possible loss is in cell N4.
- Risk-reward ratio is in cell N5.
For both maximum profit and maximum loss, positive sign means profit and negative sign means loss. It can happen (e.g. when legging into spreads) that a position's maximum profit is still a loss, or a position's maximum loss is still a profit.
The risk-reward ratio only appears when maximum profit is a finite positive number and maximum loss is a finite negative number. It is shown as reward to risk (e.g. when maximum profit is 250 and maximum loss is -100, the ratio is 2.5). Higher is better.
Alternative Position
Besides a single strategy, the calculator can model two positions at the same time, allowing you to compare strategies or variations of the same strategy (e.g. with different strikes).
The second ("alternative") position is entered below the chart (row 27 and below) in the same way as the main ("default") position.

Risk profile for the alternative position is shown in the bottom right area K27-N37. Maximum profit, maximum risk, and risk-reward ratio are shown in cells I35-I37.
The buttons below the underlying position inputs (B35-F37) make working with alternative position easier:
- Clear Alt Pos: Clear alternative position inputs and set all legs to None.
- Copy Def > Alt: Copy default position leg inputs to alternative position. This makes both positions the same (same as the original default position) and assumes you make further changes to one of them.
- Copy Alt > Def: Copy alternative position leg inputs to default position (as above, but reversed).
- Switch Def <> Alt: Switch the positions (default becomes alternative and vice versa).
Payoff Diagrams and Chart Controls
The chart in the Main sheet can display payoff diagrams for individual legs or the entire position. It can show up to three lines at the same time, so you can compare the default position with the alternative position, or display total position payoff alongside individual legs.

Setting Chart Series
What the three chart lines (blue, green, red) show is set in the dropdown boxes in K20-N22. There are two dropdowns for each line:
- The first (left) selects the position (default, alternative, or none).
- The second (right) selects the leg of that position (entire position or leg 1/2/3/4).
Always start with the left dropdown box, as changing it resets the right one to entire position.
In ODF and NoVBA versions, which don't have dropdowns, this is set by entering values. In the left input (cell L20/L21/L22) enter 0 for none (line not shown), 1 for default position, 2 for alternative position. In the right input (N20/N21/N22) enter 0 for entire position or 1, 2, 3, 4 for individual leg.
Y-Axis: Value or P/L
The chart can show either value (payoff at expiration, not considering initial cash flow) or profit/loss (payoff at expiration + initial cash flow). This is selected in the dropdown box in cell N19 (in ODF and NoVBA versions, enter 1 for value and 2 for P/L).
X-Axis Scale
Chart scale is calculated automatically to include all important points, such as current underlying price, all option strikes, and break-even points.
You can override the automatic scale by entering X-axis minimum and maximum in the yellow cells L24, L25 (keep them empty for the automatic scale).

Examples
The following are some examples how you can set up and work with different strategies in the calculator:
- Bull call spread (and showing how individual legs contribute to total P/L)
- Covered call (example of strategy with underlying position)
- Long straddle (and comparing it to long strangle as alternative position)
- Iron condor (and modeling strike selection and adjustments, like broken wing condors)
- Iron butterfly (strike selection, comparing to short straddle and iron condor)
Support & Feedback
If you have any questions or feedback, or encounter any problems or unexpected behavior, please feel free to contact me.