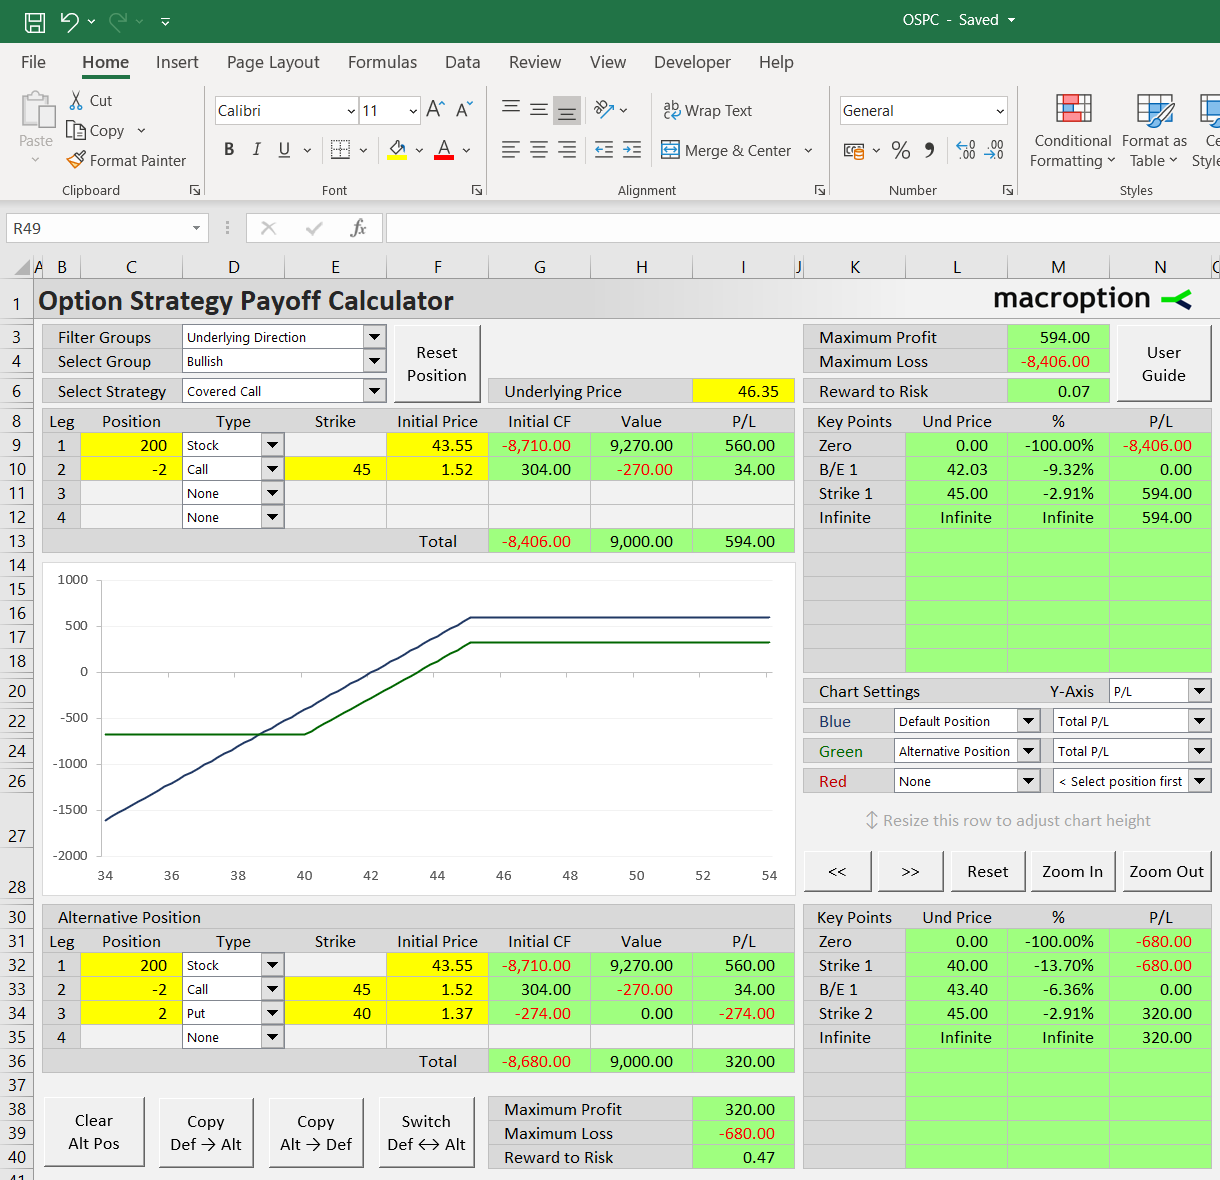
This page demonstrates how to set up and work with a covered calls in the Option Strategy Payoff Calculator.
Position Setup
You can create a covered call either manually by setting the details of the underlying and short call leg, or by loading a predefined covered call position in the dropdown box in cell E6.
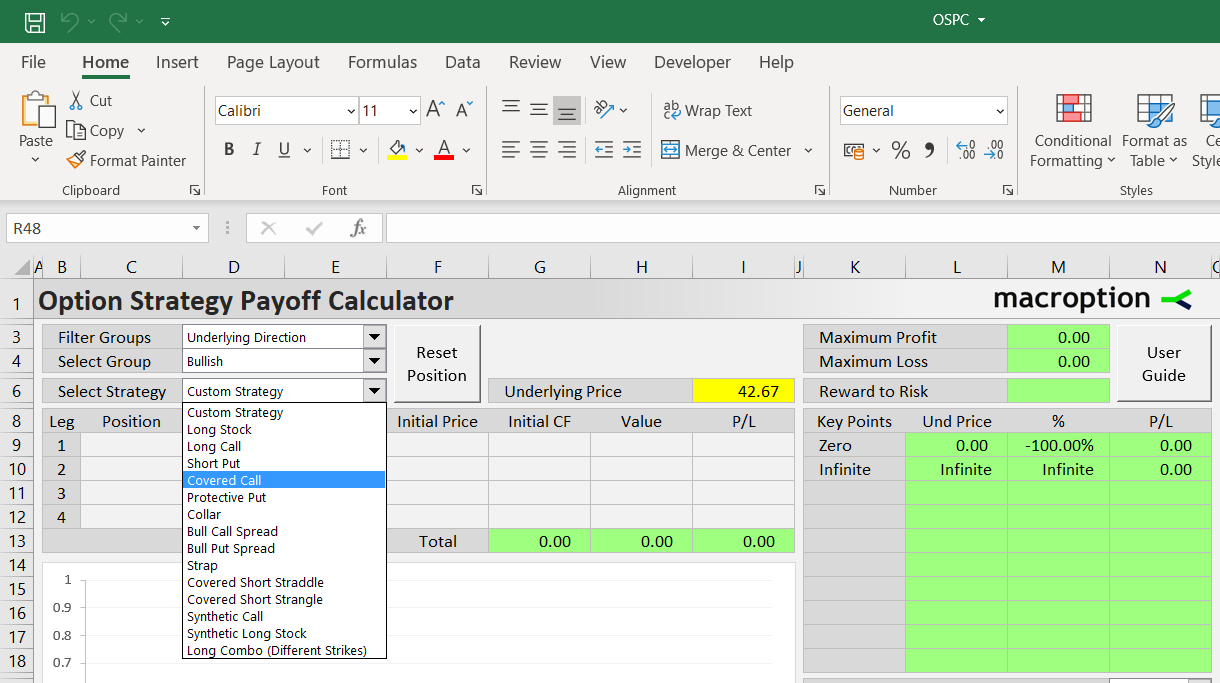
Where to Find Covered Call
You can find it via any of the following paths in the dropdown boxes in E3 (filter type), E4 (strategy group), and E6 (strategy):
- All Strategies (E3) / All Groups (E4) / Covered Call (E6)
- Number of Legs / Two Legs / Covered Call
- Number of Legs / With Underlying / Covered Call
- Direction & Volatility / Bullish / Covered Call
- Risk Profile / Limited Risk & Limited Profit / Covered Call
After selecting, the position is loaded with predefined example strike and prices. You can adjust them in the leg inputs area in cells C9-F12.
Example
Let's create a covered call position on a stock. We have bought 200 shares of the stock for 43.55 per share. We sell 2 contracts of 45-strike call options on the stock for 1.52 per share.
The calculator has space for four legs. Covered calls only use two legs: the long underlying position (leg 1, row 9) and the short calls (leg 2, row 10). The other two legs are unused; their instument type (cells D3, D4) should be set to None.
If you have selected covered call in the dropdown boxes, these are set automatically. We only need to adjust position size, strike, and initial price for the two legs to match our example.
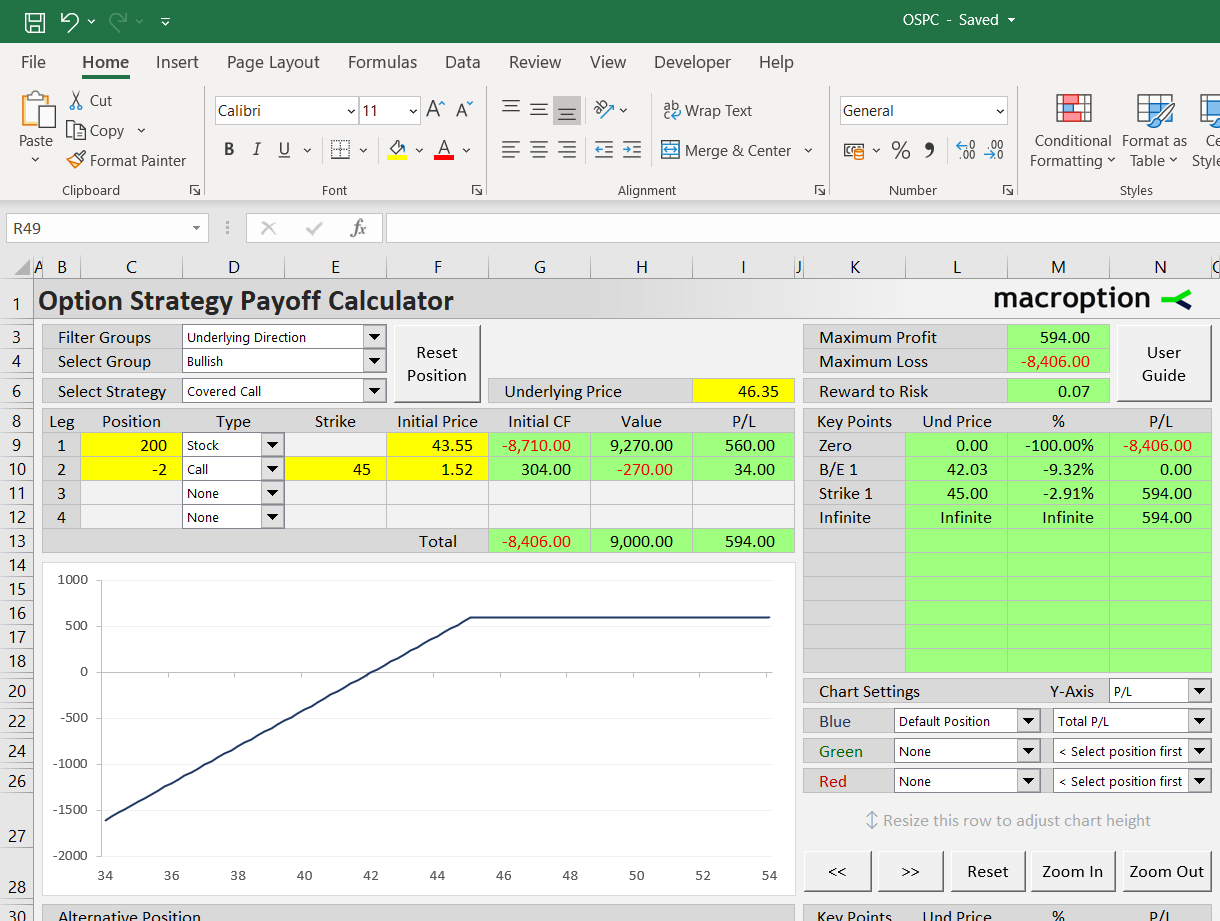
Position sizes are entered in column C. Units are number of shares for the long underlying position (in our example 200 shares, cell C9) and number of contracts for the short calls (in our case 2 contracts, with minus sign because we are short, in cell C10).
The number of shares per one option contract is 100 by default, as for US stock options. It is easy to change in the Preferences sheet (the OptContractSize setting). You can also change the underlying multiplier, which is 1 by default, for instance when working with futures options (the UndContractSize setting).
Strikes are entered in column E. The long underlying position has no strike. Enter the short call strike in cell E10, in our example 45.
Initial prices are entered in column F. For the long underlying position it is the price for which we have bought the shares, per share – in our example 43.55. For the short calls it is the option premium received for selling the options – in our example 1.52. Both prices are with positive sign.
In column G you can see how these initial prices translate to initial cash flow. We have paid $8,710 for the shares (cell G9) and received $304 for the call options (cell G10). Total initial cash flow is -$8,406 (cell G13).
Value and P/L at Given Underlying Price
To calculate the position's value and profit or loss at expiration, enter a price in the yellow cell I6. Let's use 46.35 for example.
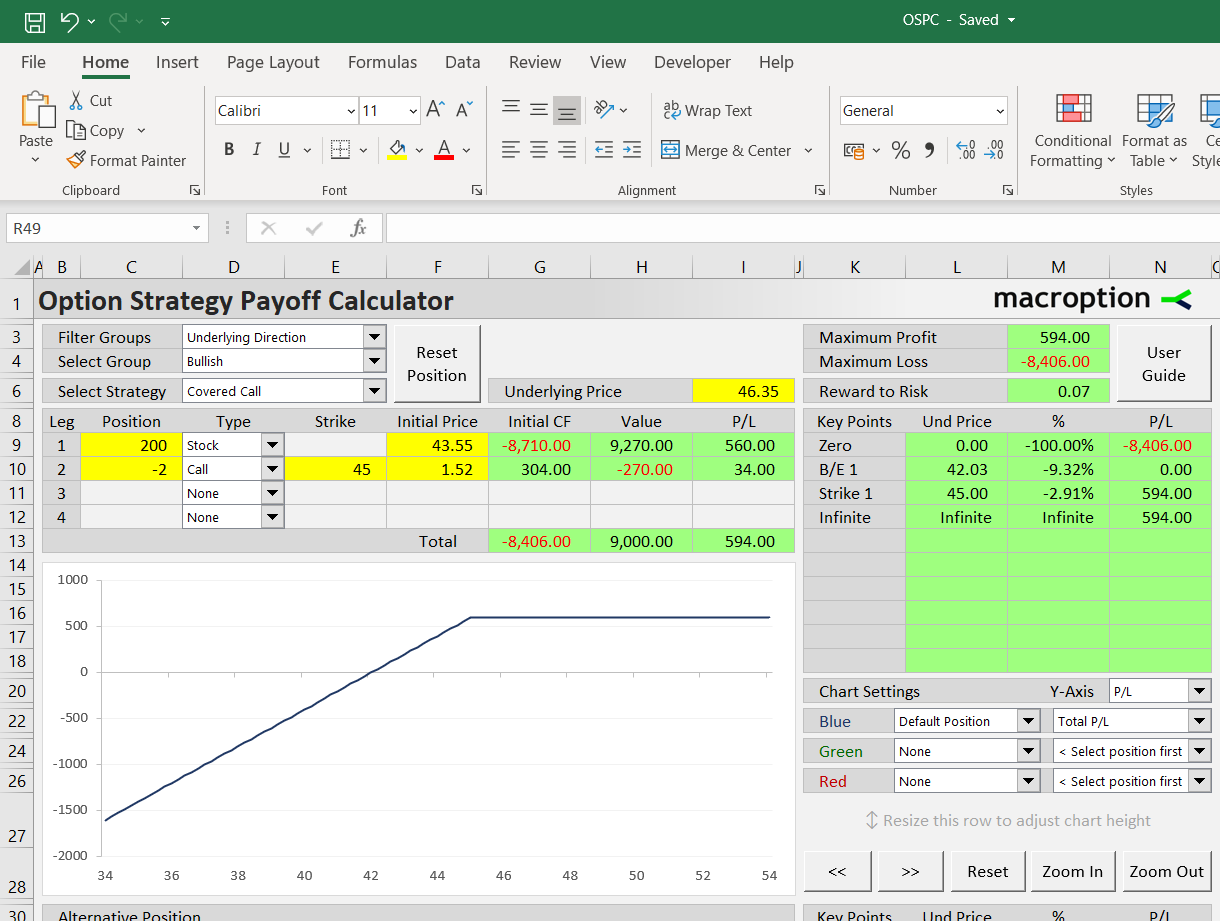
In cells H9-H13 you can see the position's value at expiration. The long stock position will be worth $9,270 (200 shares x 46.35). The short calls are worth $270 ($1.35 in the money x 2 contracts x 100 shares per contract). But we are short the calls, so their value has negative sign (reduces our profit or increases our loss).
Total value of the covered call position with the underlying at 46.35 at expiration is the sum of the two legs: 9,270 – 270 = $9,000 (cell H13).
In column I you can see profit or loss. In our example we make $560 on the shares (we bought the shares for 43.55, they are now worth 46.35 or 2.80 more, times 200 shares) and $34 on the short calls (we have initially sold them for $1.52, but at expiration they are worth only $1.35 or $0.17 less, times 2 contracts of 100 shares each).
Total P/L from the covered call position is the sum of the two legs: 560 + 34 = $594 (cell I13).
This way you can calculate value and P/L at expiration at any underlying price by changing the value in the yellow cell I6.
Risk Profile and Break-Even Points
You can also see an overview of P/L at important price points on the right, in cells K8-N18.
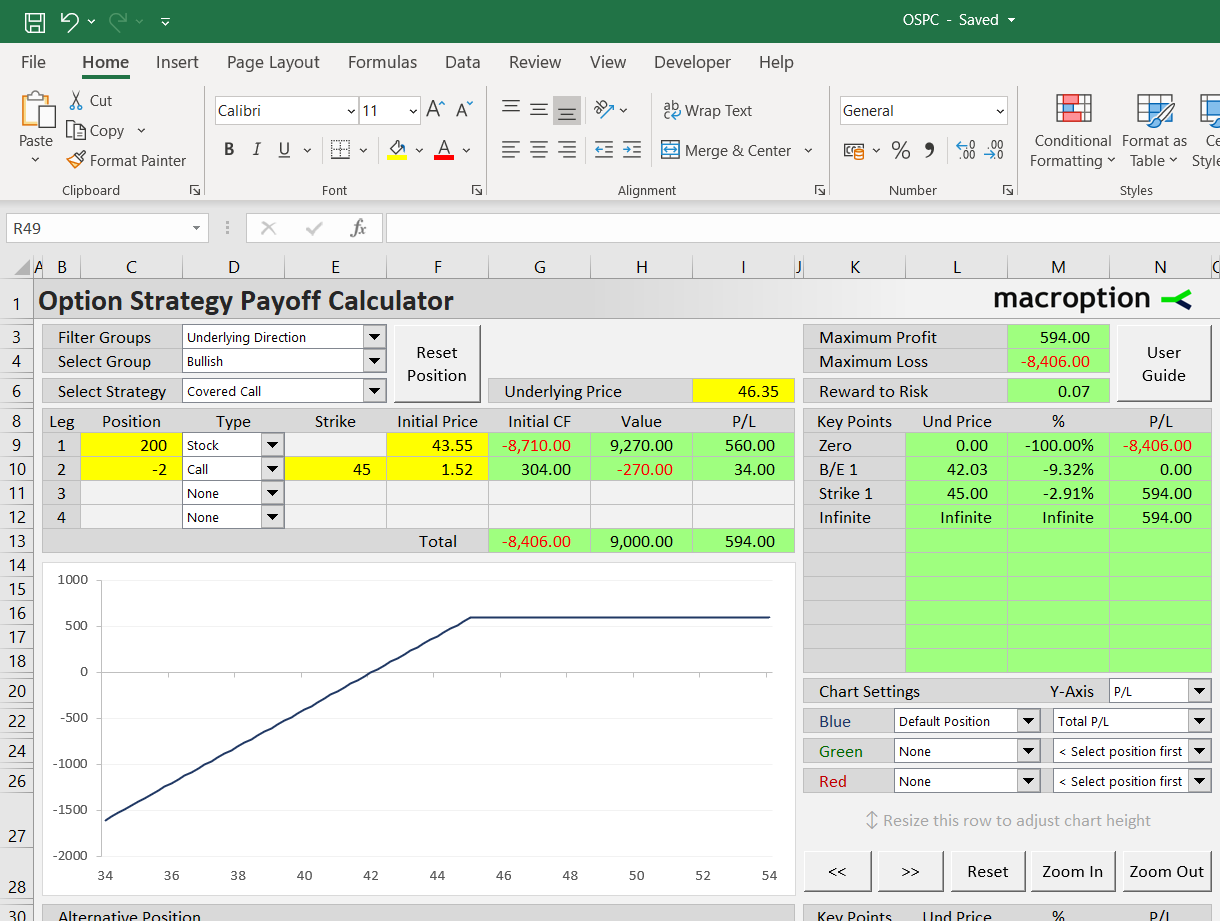
The prices are shown based on the current position and include all strikes, break-even points and extremes (zero and infinite underlying price). In our covered call example you can see P/L at the call strike $45 and the break-even point $42.03.
In column M you can also see how far each price point is from the current underlying price (the one set in cell I6). In our example, the stock price would have to fall by 9.32% (cell M10) from the current $46.35 to reach the break-even point $42.03 (cell L10), before the position turns into a loss at expiration.
Maximum profit and maximum loss are shown in cells M3 and M4, respectively. In our example they are $594 (if price ends up at or above the call strike) and -$8,406 (if price drops to zero, our position is worthless, and total loss equals net initial cost).
In cell M6 you can see the risk-reward ratio, calculated as reward to risk, or maximum profit divided by maximum loss. In our example it is 0.07 (594 / 8,406). Covered calls usually have maximum profit much smaller than maximum loss, due to the possibility of underlying price dropping to zero and the upside capped at the call strike.
Payoff Diagrams
The chart in the middle of the Main sheet can display payoff diagram for the entire covered call, as well as individual legs.
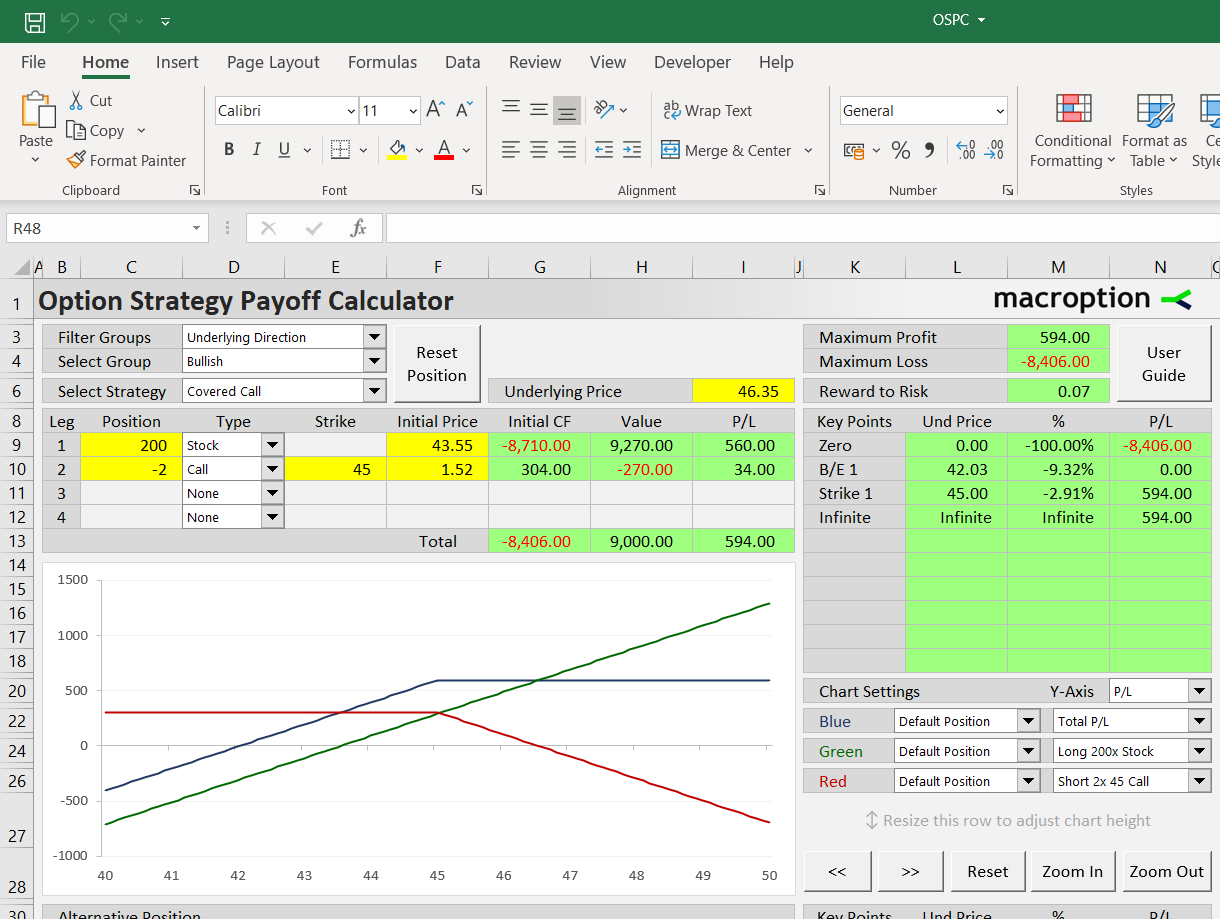
You can select individual chart series in the dropdown boxes in cells K22-N26. You can also adjust the chart scale using the buttons below.
Position Variations (Choosing Different Strikes)
The calculator can model two positions at the same time, allowing you to compare different versions of the covered call (with different strikes or position sizes).
For example, if you feel selling the 45-strike call gives up too much of the upside, you can model an alternative covered call position with the short call strike of 47.50.
The second position is configured below the chart in rows 32-35 in the same way as the default position. For quick set up, you can click the "Copy Def > Alt" button and copy the default position to the alternative; then you only need to change the call strike and initia price. Let's say we can sell the 47.5-strike call for 0.80. Change cell E33 to 47.5 and F33 to 0.8.
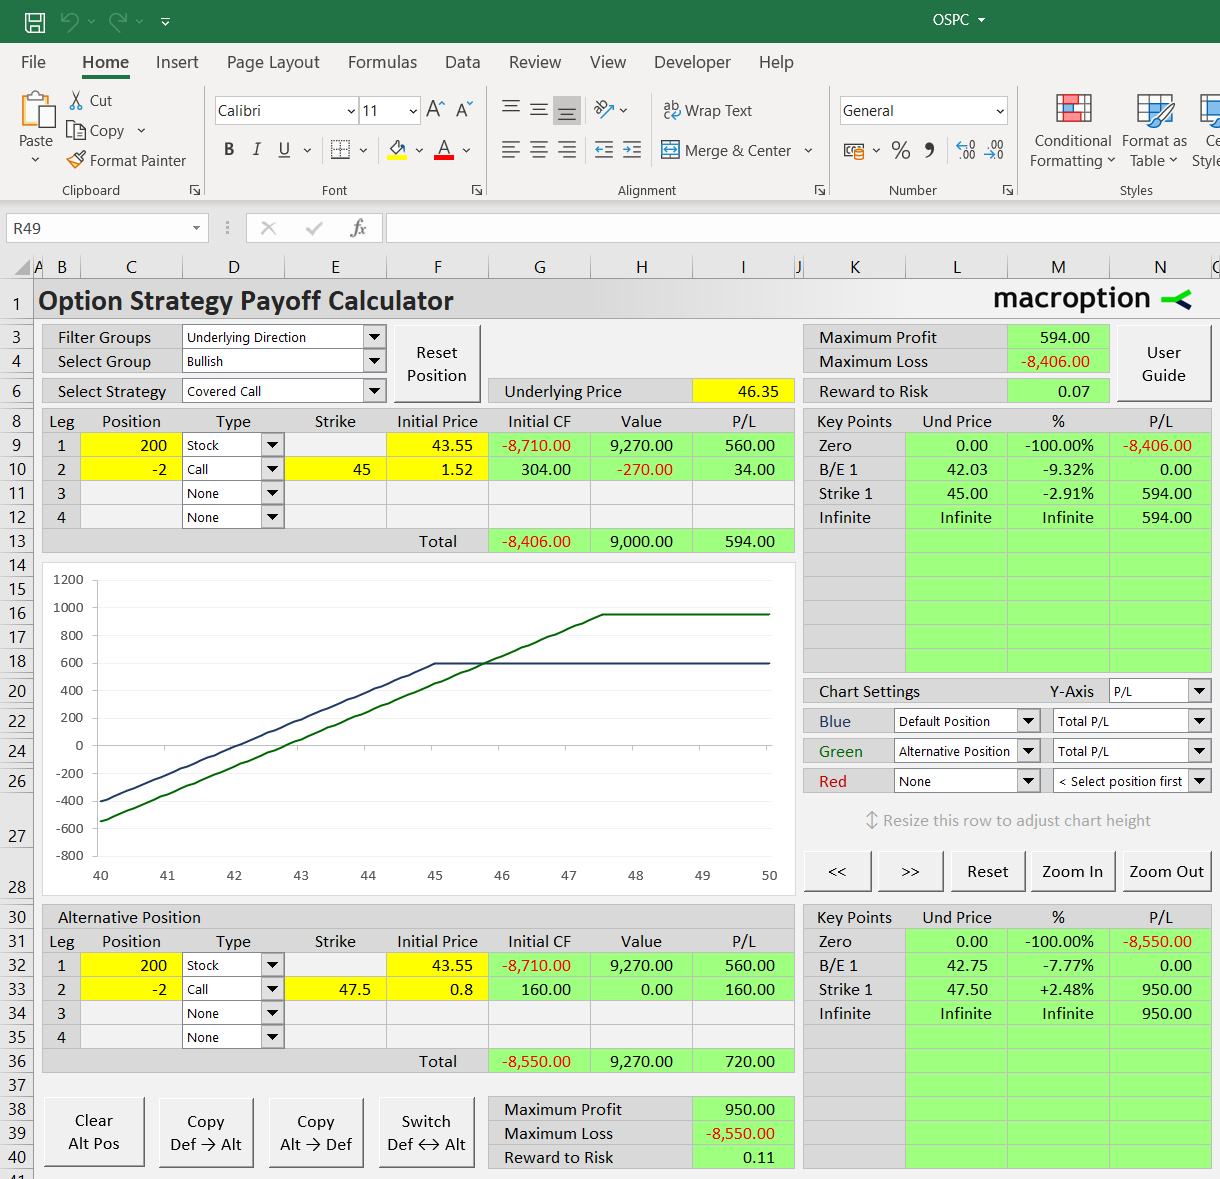
You can see the alternative position's P/L at important price levels in the area K30-N40, including the break-even at $42.75 (cell L32). Maximum profit, maximum loss, and risk-reward ratio are shown in cells I38-I40.
Set the chart's green line (cell K24-N24) to Alternative Position, Total P/L and the red line (K26-N26) to None. Now both covered call positions are displayed in the chart. Blue line shows the default 45-strike covered call; green line shows the alternative 47.50-strike covered call.
Comparing to Other Strategies
In the same way, you can compare the covered call position to entirely different strategies. For instance, you can add put options as downside protection to reduce maximum loss and improve the risk-reward ratio (and effectively turn the covered call into a collar).
