This page demonstrates how to set up and work with a bull call spread (long call spread, debit call spread) position in the Option Strategy Payoff Calculator.
Position Setup
The easiest way to create a bull call spread position is to select "Bull Call Spread" in the strategy selection dropdown box in cell E6.
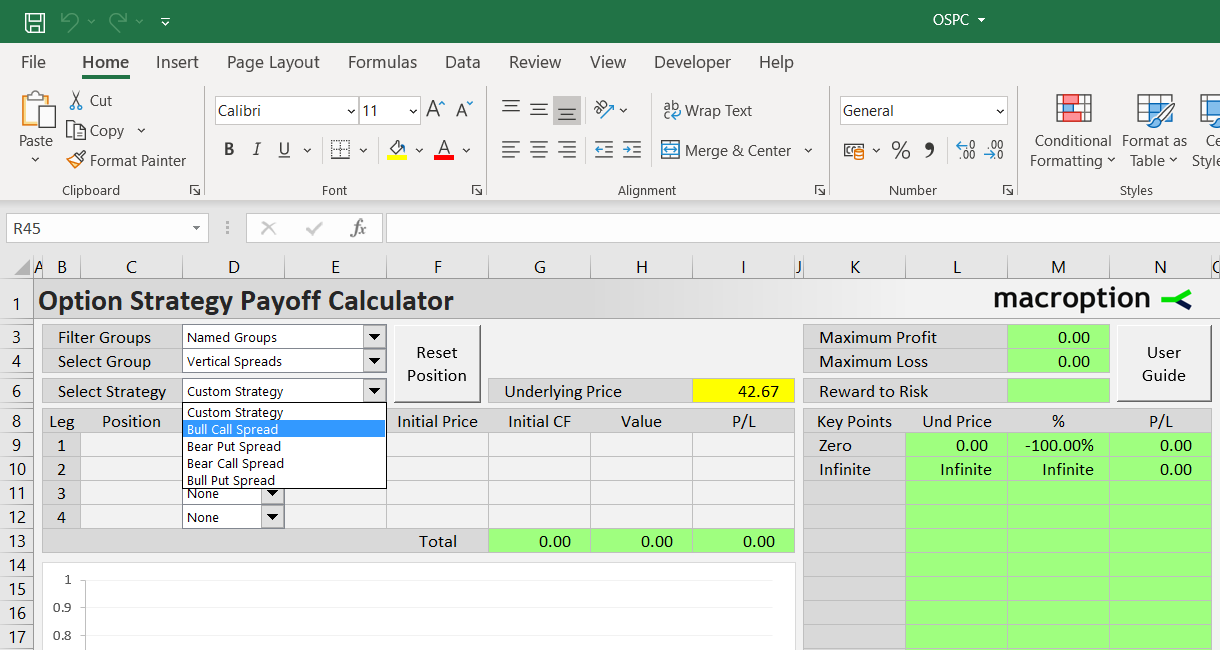
Where to Find Bull Call Spread
You can find it via any of the following paths in the dropdown boxes in E3 (filter type), E4 (strategy group), and E6 (strategy):
- All Strategies (E3) / All Groups (E4) / Bull Call Spread (E6)
- Named Groups / Vertical Spreads / Bull Call Spread
- Number of Legs / Two Legs / Bull Call Spread
- Direction & Volatility / Bullish / Bull Call Spread
- Risk Profile / Limited Risk & Limited Profit / Bull Call Spread
You can also set all the position inputs manually in cells C9-F12 (position, instrument type, strike, initial price for each leg).
Example
A bull call spread position consists of two call options, one long call with lower strike and one short call with higher strike. Let's model an example bull call spread with the following two options:
- Long 3 contracts of 45 strike call option, bought for 4.38 per share.
- Short 3 contracts of 50 strike call option sold for 2.02 per share.
The long call with be our leg 1 (row 9) and the short call leg 2 (row 10). Legs 3 and 4 are unused; their instrument types should be set to None (D11, D12).
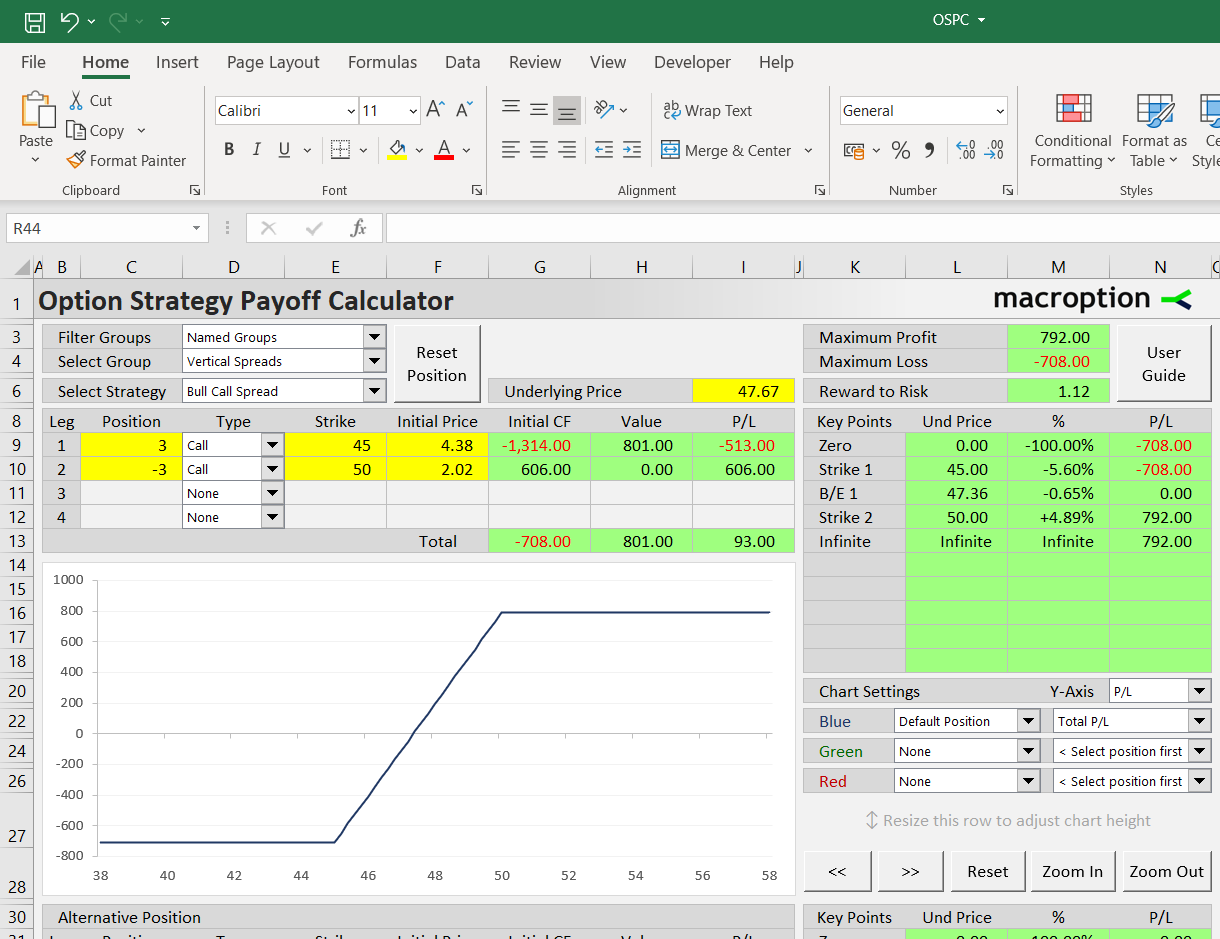
The position sizes of the long (C9) and short (C10) call option should be the same, only with opposite signs (+3 contracts for leg 1 and -3 contracts for leg 2).
The strikes are entered in cells E9 (lower strike for the long call option) and E10 (higher strike for the short call).
Initial option prices are entered in cells F9, F10. Cell F9 is the price for which the lower strike call option is bought when opening the position. Cell F10 is the price for which the higher strike short call option is sold when opening the position. Both prices should be per share (or per unit of underlying). Both should be positive numbers. In our example, F9 is 4.38 and F10 is 2.02.
Value and P/L at Given Underlying Price
In column G you can see the initial cash flow for each leg: -1,314 for leg 1 in cell G9 (we pay 4.38 per share x 3 contracts x 100 shares per contract) and +606 for leg 2 in cell G10 (we get 2.02 x 3 x 100). Cell G13 shows net initial cash flow for the entire spread: -1,314 + 606 = -708. Bull call spread is a debit spread – we pay $708 when setting up the position.

The next two columns, H and I, show the value and profit or loss at given underlying price at expiration. The underlying price is entered in the yellow cell I6; in our example it is $47.67. If the underlying ends up at this price when the options expire, the $45 strike calls will be in the money and worth $801 (2.67 x 3 x 100 in cell H9). The $50 strike calls will expire worthless (cell H10 shows zero). Net value of the spread will be $801 (cell H13).
Column I shows profit or loss, which is the sum of initial cash flow (column G) and payoff at expiration (column H). In our example the P/L of individual legs is -513 (cell I9 for leg 1) and +606 (cell I10 for leg 2). We lose $513 on the long $45 strike calls, which we initially bought for $1,314, but they are worth only $801 at expiration. But we gain $606 on the short $50 strike calls, as we keep all the cash received when opening the position. The entire spread makes a profit of $93 (cell I13).
Risk Profile and Break-Even Points
The above value and P/L only applies if the underlying ends up precisely at $47.67 (the price in I6) at expiration. A more complete overview of P/L at various prices is available on the right, in cells K8-N18. It shows the position's total P/L at each strike and break-even point.
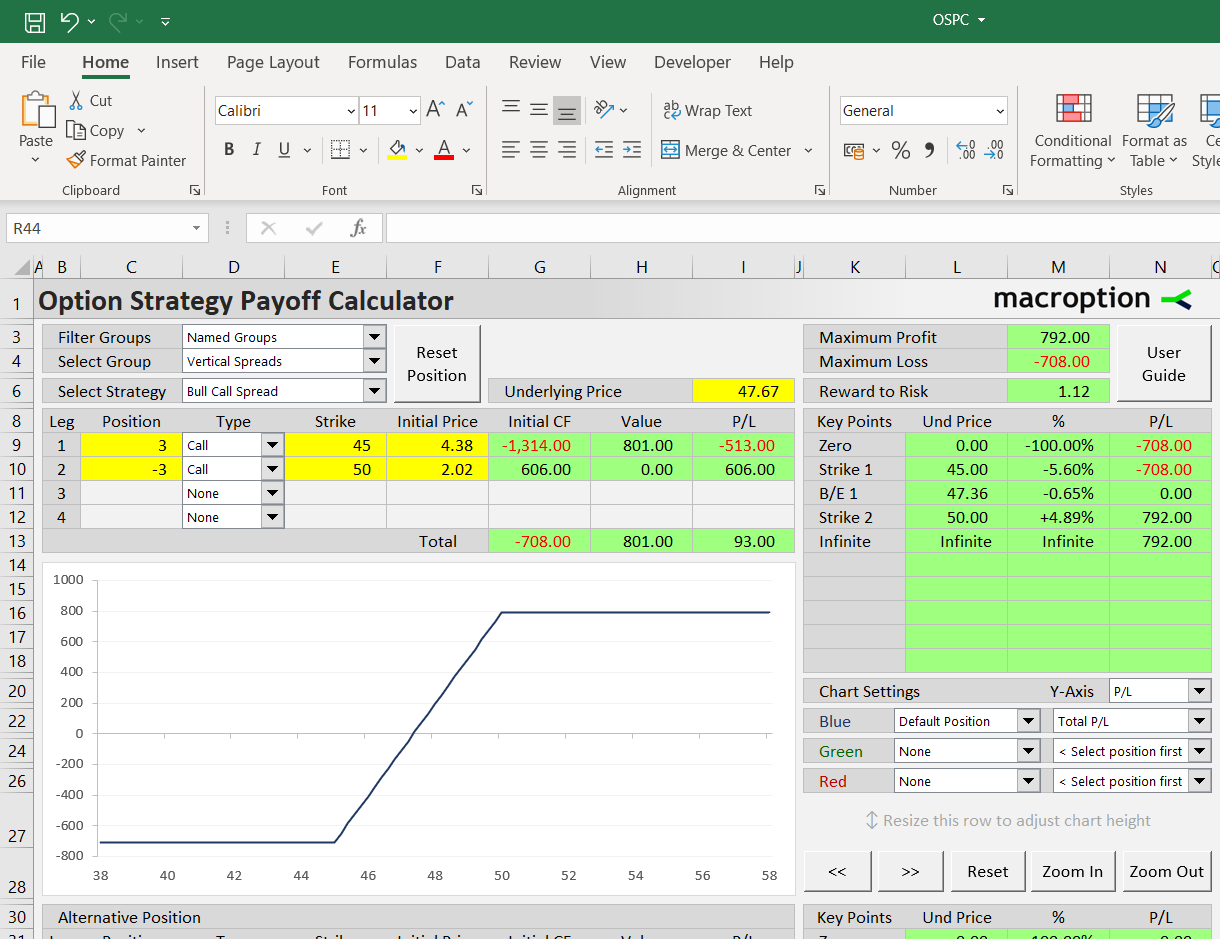
Bull call spread typically has one break-even point somewhere between the two strikes – in our example at underlying price of $47.36 (cell L11), which is -0.65% from the current underlying price (cell M11). P/L at the break-even price is of course zero (cell N11).
It also shows P/L at both tails: If underlying price drops to zero, P/L will be -$708, same as at the lower strike. Hypothetically, at infinite underlying price the spread's P/L will be +$792, same as at the higher strike. Bull call spread always has constant P/L below the lower strike (usually a loss) and above the higher strike (usually a profit).
Maximum profit (+$792) and maximum loss (-$708) are shown in cells M3 and M4, respectively.
Cell M6 calculates the risk-reward ratio. The format is reward (maximum profit) divided by risk (maximum loss) – in our example 792 / 708 = 1.12.
Payoff Diagrams
The central point of the calculator's Main sheet is the chart, which shows payoff diagrams for individual legs and/or the entire spread.
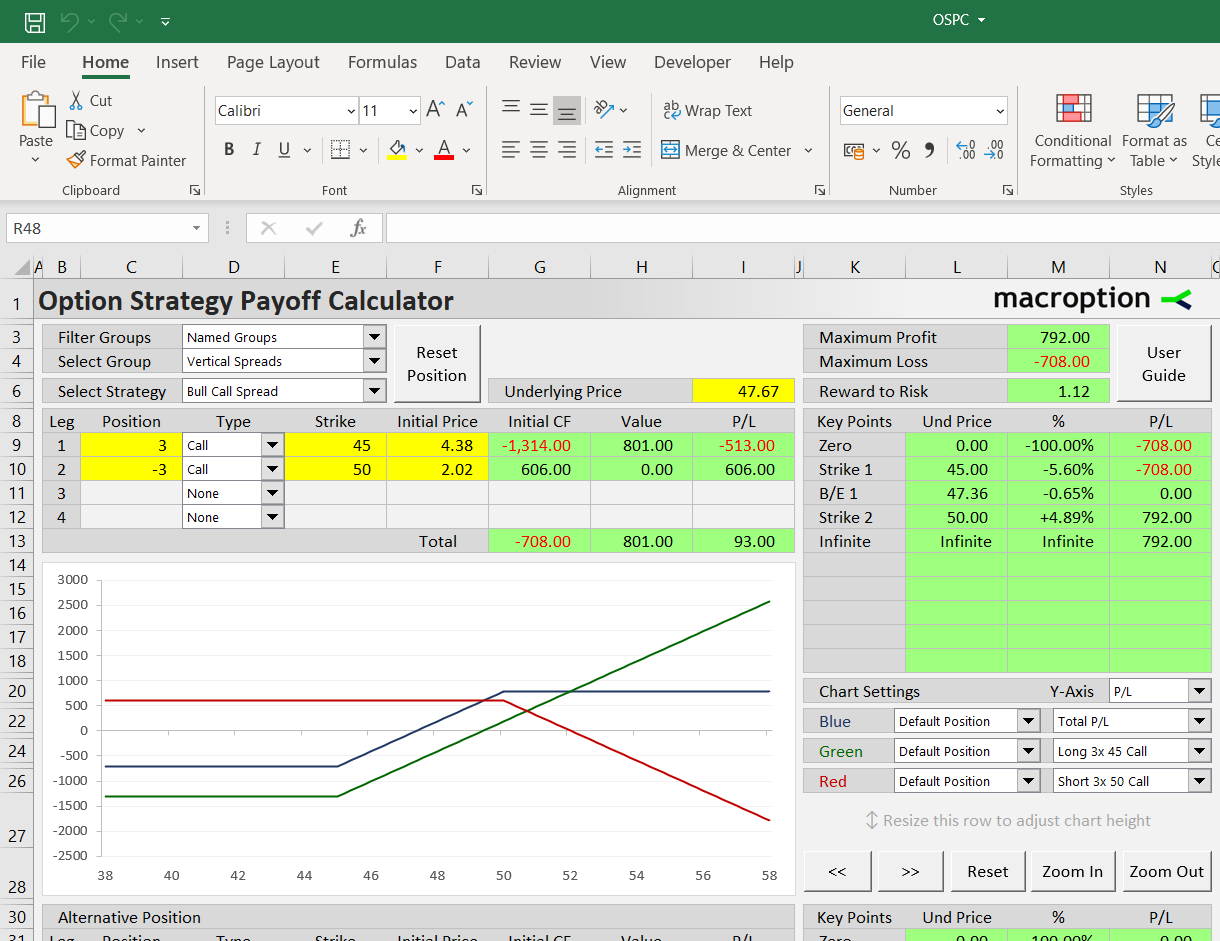
You can select what is shown using the dropdown boxes in cells K20-N26, titled Chart Settings.
In the dropdown in cell N20 you can choose either value (payoff at expiration without initial cash flow) or P/L (payoff plus initial cash flow).
In the dropdowns below you can select individual series. The chart can draw up to three lines at the same time, so you can display the P/L of the entire spread (blue line) and the two individual legs (green line shows the long $45 strike call, red line the short $50 call).
Position Variations (Choosing Different Strikes)
You can also use the calculator to model position variations, for example when deciding which strikes to use for a potential trade.
Besides the "default" position entered in rows 9-12, you can create a second "alternative" position in rows 32-35 below the chart. The inputs are the same (position, instrument type, strike, initial price in columns C-F).
You can use the buttons below to create the alternative position quickly from the default position. When you click the button "Copy Def > Alt", the current default position will be copied to the alternative position. Then you can make the adjustments, for instance change the strikes and initial prices.
For example, lets create a second bull call spread with strikes 48 and 53, and compare it to our "default" 45-50 spread. Click the "Copy Def > Alt" button and then overwrite the strikes in cells E32, E33 to 48 and 53, respectively. Also change the initial prices in cells F32, F33.
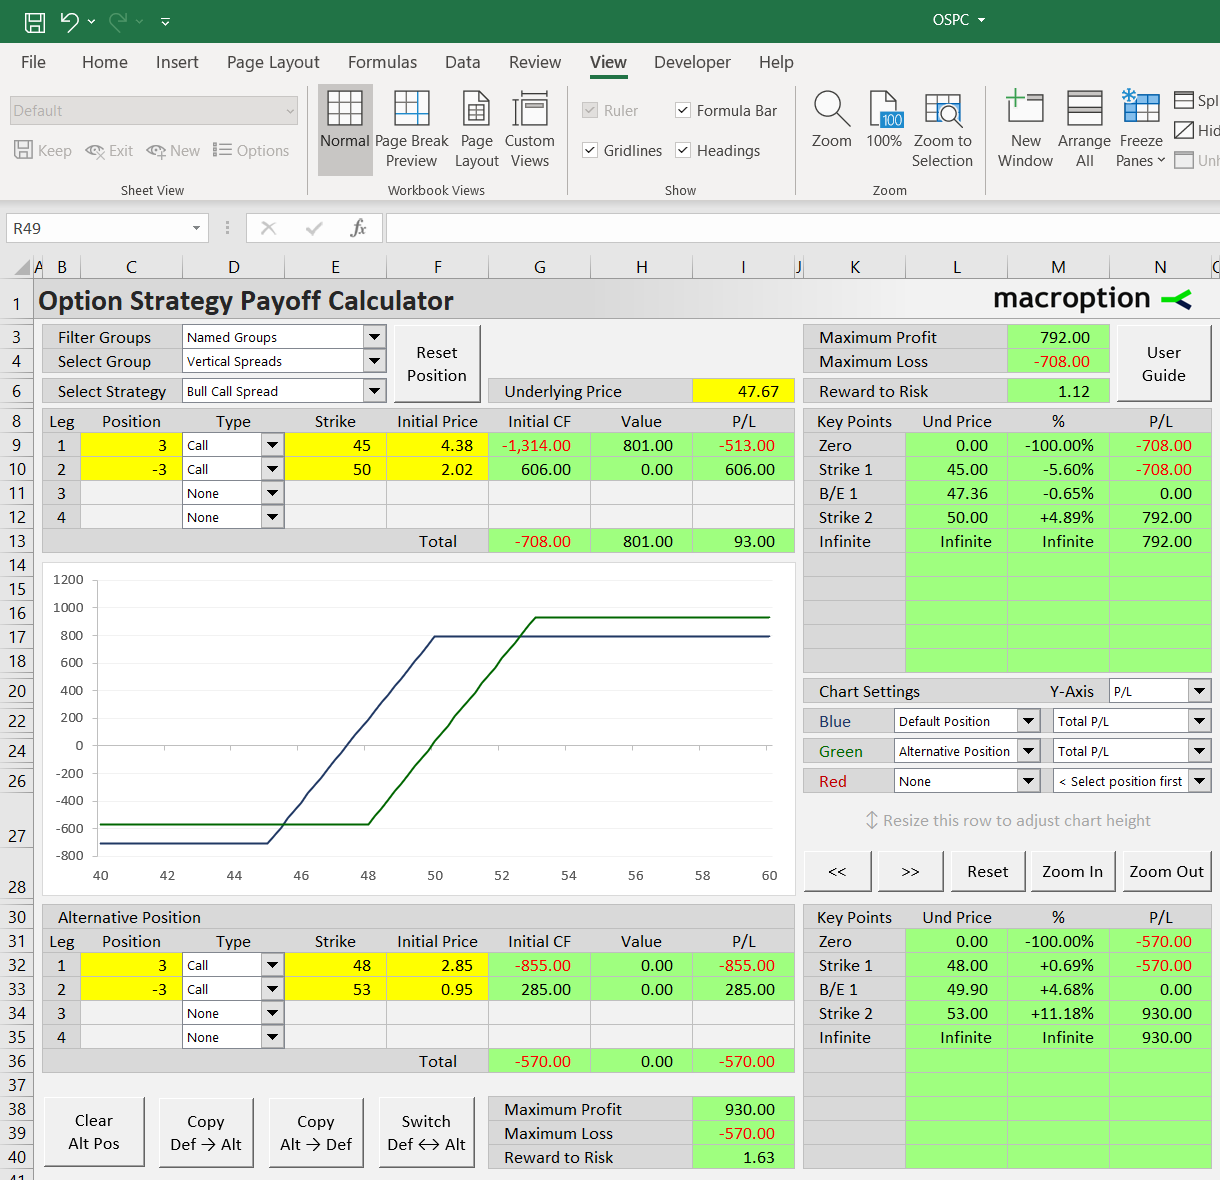
You can see the alternative position's P/L at different underlying prices in cells K30-N40. Its maximum profit, maximum loss, and risk-reward ratio are in cells I38-I40.
If you compare them to the default position's figures, you can see that by using higher strikes we have increased the spread's profit potential (from $792 to $930, cell I38) reduced risk (from $708 to $570, cell I39) and therefore improved the risk-reward ratio from 1.12 to 1.63 (cell I40).
There is a tradeoff though – our break-even point shifts up from 47.36 to 49.90 (cell L33). Underlying price must increase by 4.68% (cell M33) to reach our new break-even.
You can compare both positions visually in the chart. Keep the blue line selection (cells K22-N22) at Default Position and Total P/L. Change the green line (cells K24-N24) to Alternative Position and Total P/L. Set the red line (cells K26-N26) to None. The chart shows payoff diagrams for both positions and visually confirms what the numbers tell: The alternative position (green line) reaches slightly higher profit at high prices and smaller loss at low prices. At the same time, it requires higher price to turn profitable.
This way you can use the calculator when deciding strikes for a potential trade.
Comparing to Other Strategies
The alternative position does not need to be the same strategy as the default position. Besides strike and initial price, you can also change each leg's instrument type and position size.
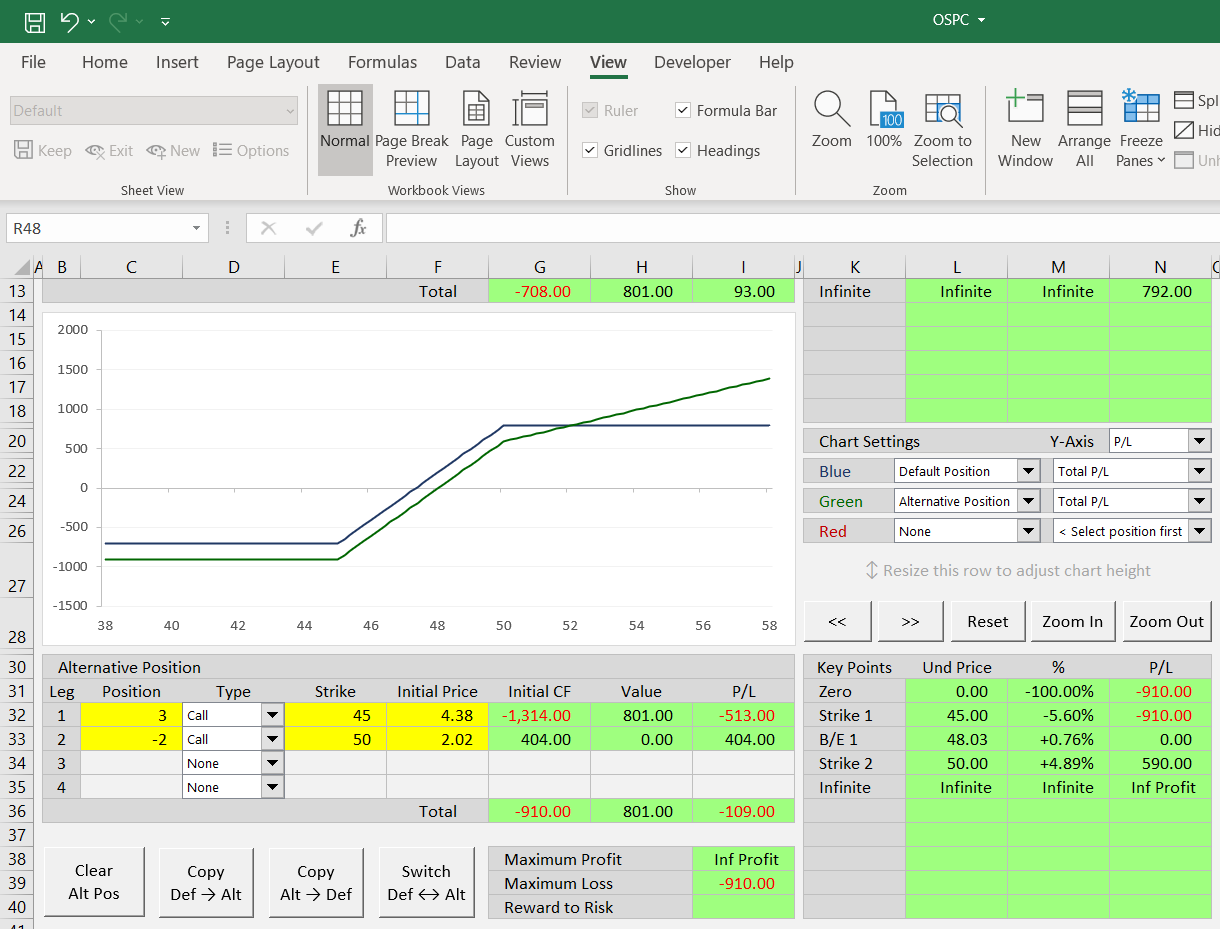
This way, you can compare the 45-50 bull call spread to a $45 strike long call (without the short call leg), to a ladder or ratio spread. For setup, you can use the buttons below the alternative position to clear alternative position, copy one position to another, or switch the two positions.
For example, you can model how the risk metrics and payoff diagram will change if you sell only 2 instead of 3 contracts of the $50 strike call. Click the "Copy Def > Alt" button and then overwrite leg 2 position size to -2 in cell C33.
