This page demonstrates how to model iron butterfly in the Option Strategy Payoff Calculator in Excel.
Position Setup
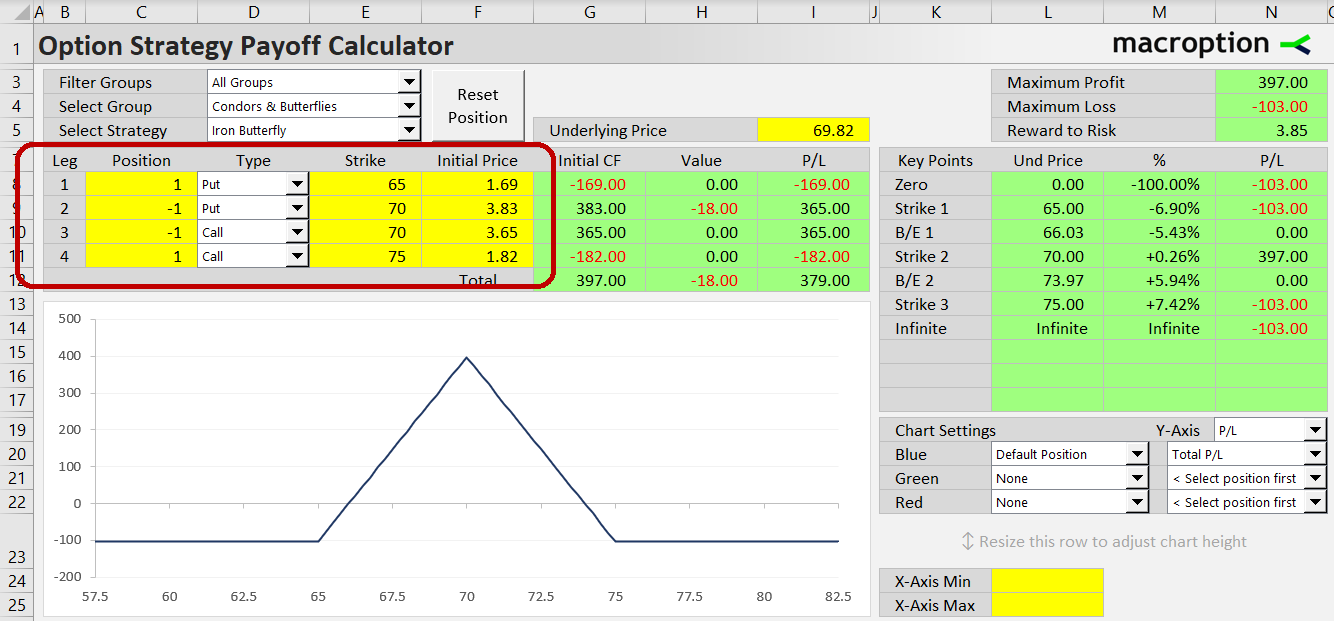
First you need to set up the position - enter individual leg details such as option type, position size, strike, and entry price, in rows 8-11. For faster setup, you can load the legs automatically by selecting Iron Butterfly from the strategy selection dropdown box in cell E5. Strikes also load automatically based on the current underlying price value (cell I5); they can be changed afterwards.
Where to Find Iron Butterfly
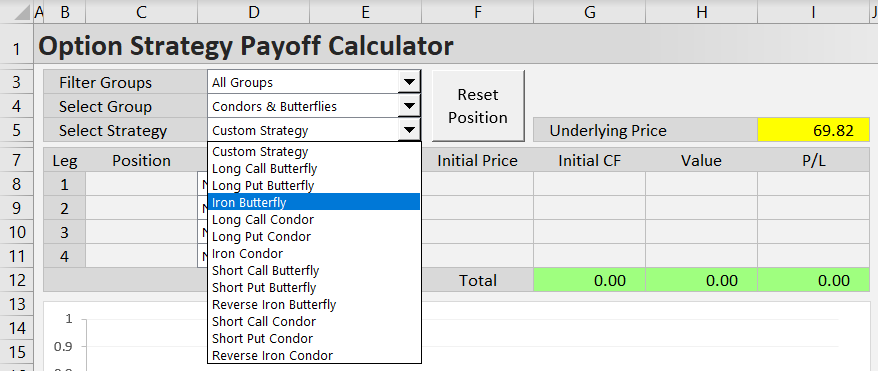
Iron butterfly can be found in the following option strategy groups (using dropdown boxes in cells C3, D3, E3):
- All Groups (E3) / All Strategies (E4) / Iron Butterfly (E5)
- Named Groups / Condors & Butterflies / Iron Butterfly
- Number of Legs / Four Legs / Iron Butterfly
- Direction & Volatility / Non-Directional / Iron Butterfly
- Risk Profile / Limited Risk & Limited Profit / Iron Butterfly
Custom Position Setup
After the position is loaded, you can adjust the automatic position sizes, strikes, and entry prices to model your preferred position.
Alternatively, you can set up everything from scratch, including the option type dropdown boxes (call/put, column D), which can be set for each leg individually.
Example
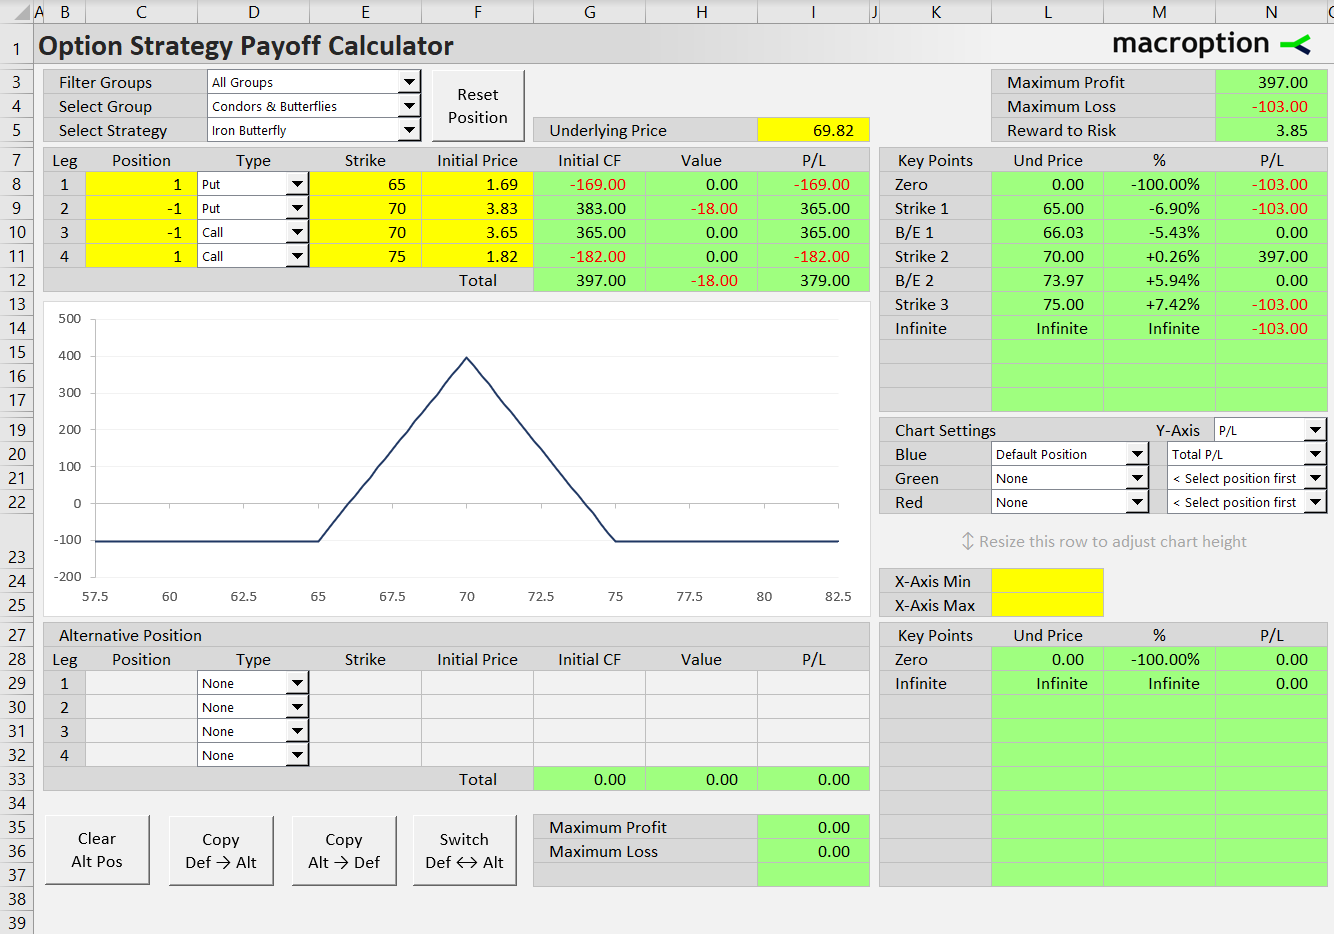
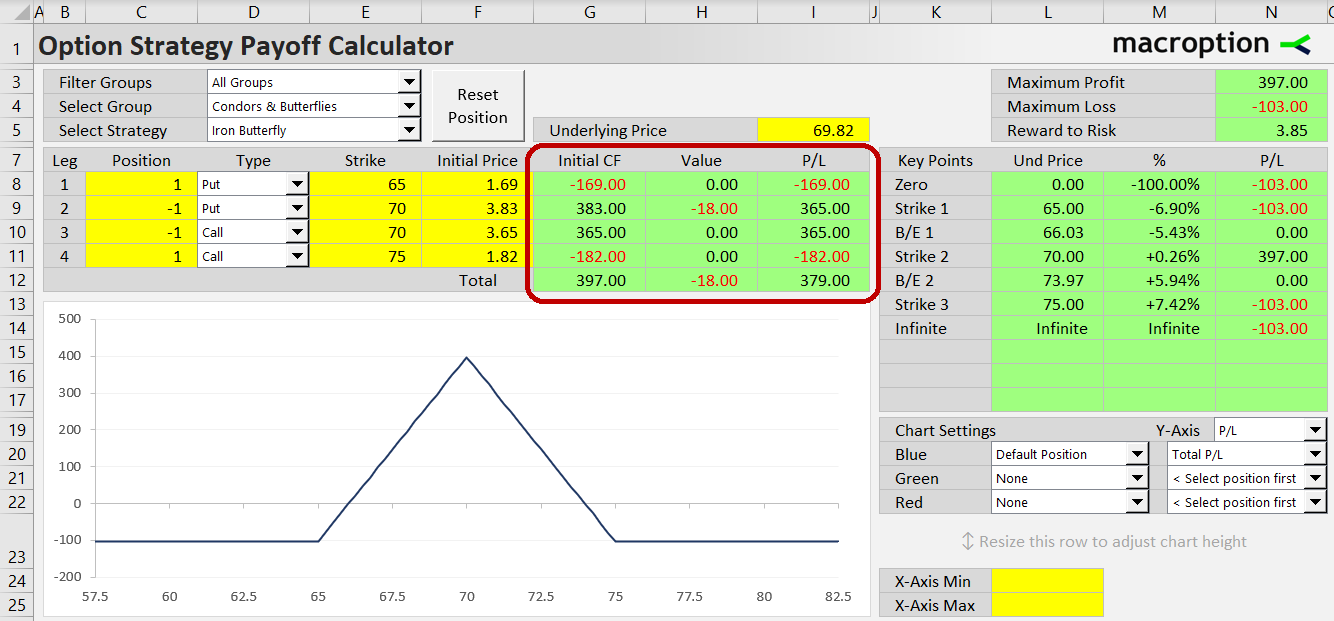
The above screenshot shows an iron butterfly position with strikes 65-70-75. It includes the following options:
- Leg 1 (row 8 in the calculator): Long 65-strike put.
- Leg 2 (row 9): Short 70-strike put.
- Leg 3 (row 10): Short 70-strike call.
- Leg 4 (row 11): Long 75-strike put.
For each leg, we need to set position size (column C), option type (column D), strike (column E), and initial price (columns F). The following are examples for leg 1 in row 8 (long 1 contract of 65-strike put, bought for $1.69 per share):
- Cell C8 (position size) is +1 (long one option contract).
- The dropdown box in cell D8 is "Put".
- Cell E8 (strike) is 65.
- Cell F8 (initial price) is 1.69.
Like strikes and position sizes, example initial prices are loaded automatically - they can be changed by simply overwriting the values in the yellow cells F8-F11.
Initial prices always have positive sign, for both long and short options.
On the contrary, position size in column C has negative sign for short positions (legs 2 and 3 in our example).
Keep in mind that all legs position sizes must be the same in iron butterfly and strikes follow a strict order. The long put strike is lowest, followed by the short put and short call strikes, which are both the same, and finally the long call strike, which is highest. Furthermore, the distances of the long put and long call strike from the middle short strike must be equal.
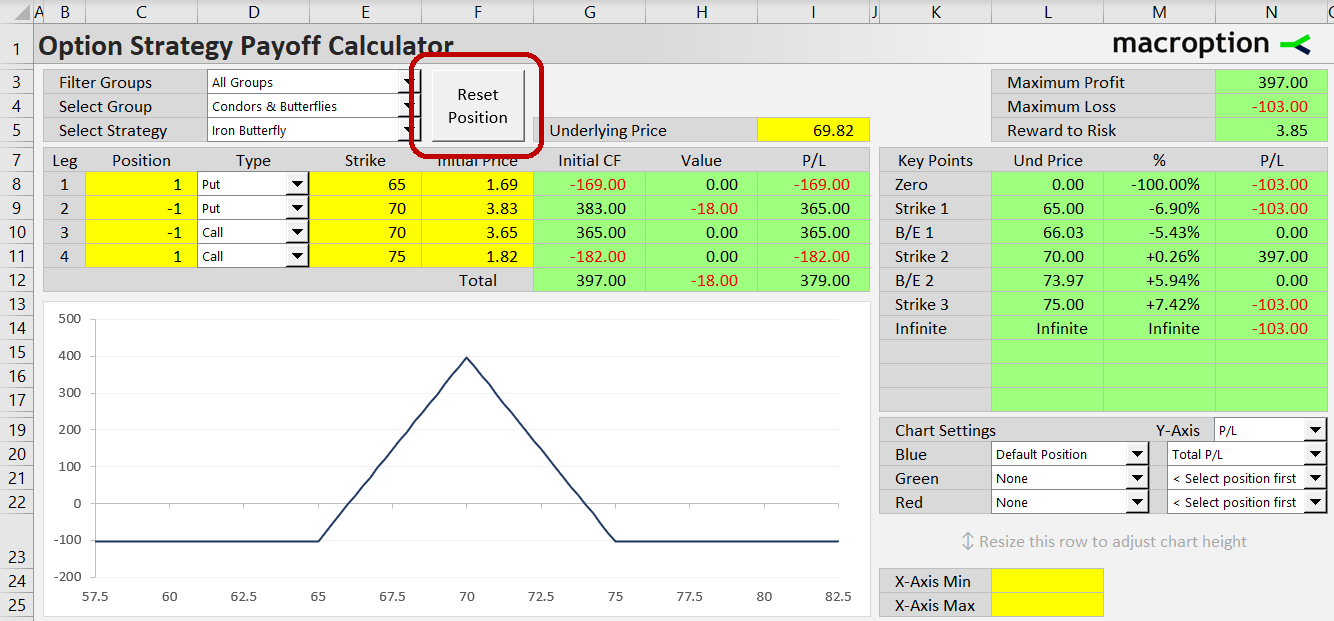
You can always load the automatic example settings back by clicking the Reset Position button.
Position Value and Profit or Loss
In the green columns G, H, I you can see initial cash-flow, current value (at given underlying price in cell I5), and profit or loss (which is the sum of initial cash flow and current value). These statistics are available for each of the four legs individually (row 8-11) and for the entire iron butterfly position (row 12).
Risk Profile
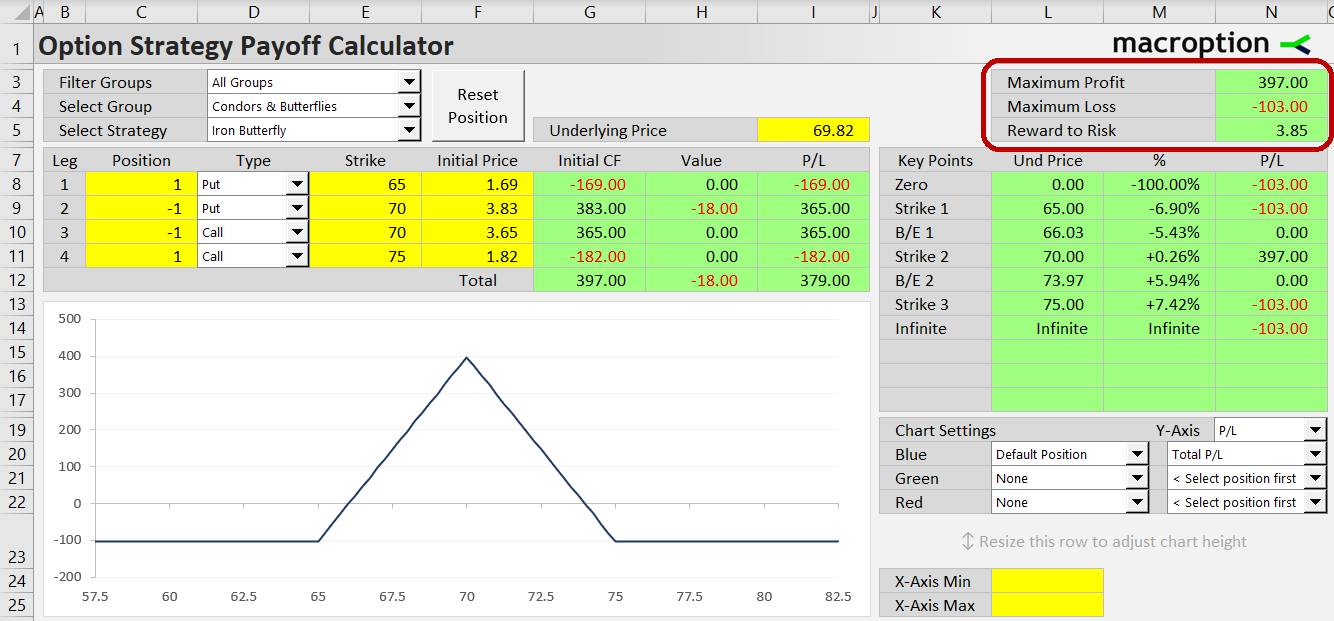
In the top right corner you can view maximum profit (cell N3), maximum loss (N4), and risk-reward ratio (N5). The ratio is in the format maximum profit / maximum loss, so R/R of 3.85 means that potential profit ($397) is 3.85x greater than risk ($103).
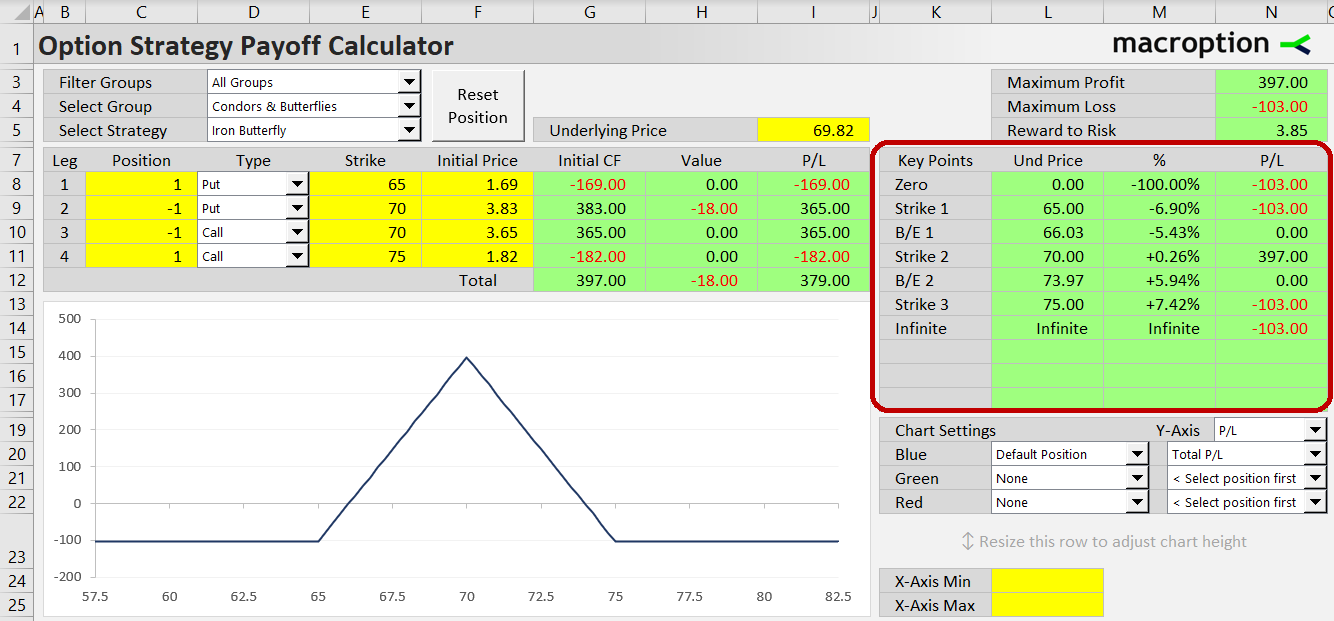
In the cells below (K7-N17) you can see profit or loss at all important points, including all strikes and break-even points. Column M shows percentage change to the particular price from current underlying price (cell I5).
Payoff Diagram
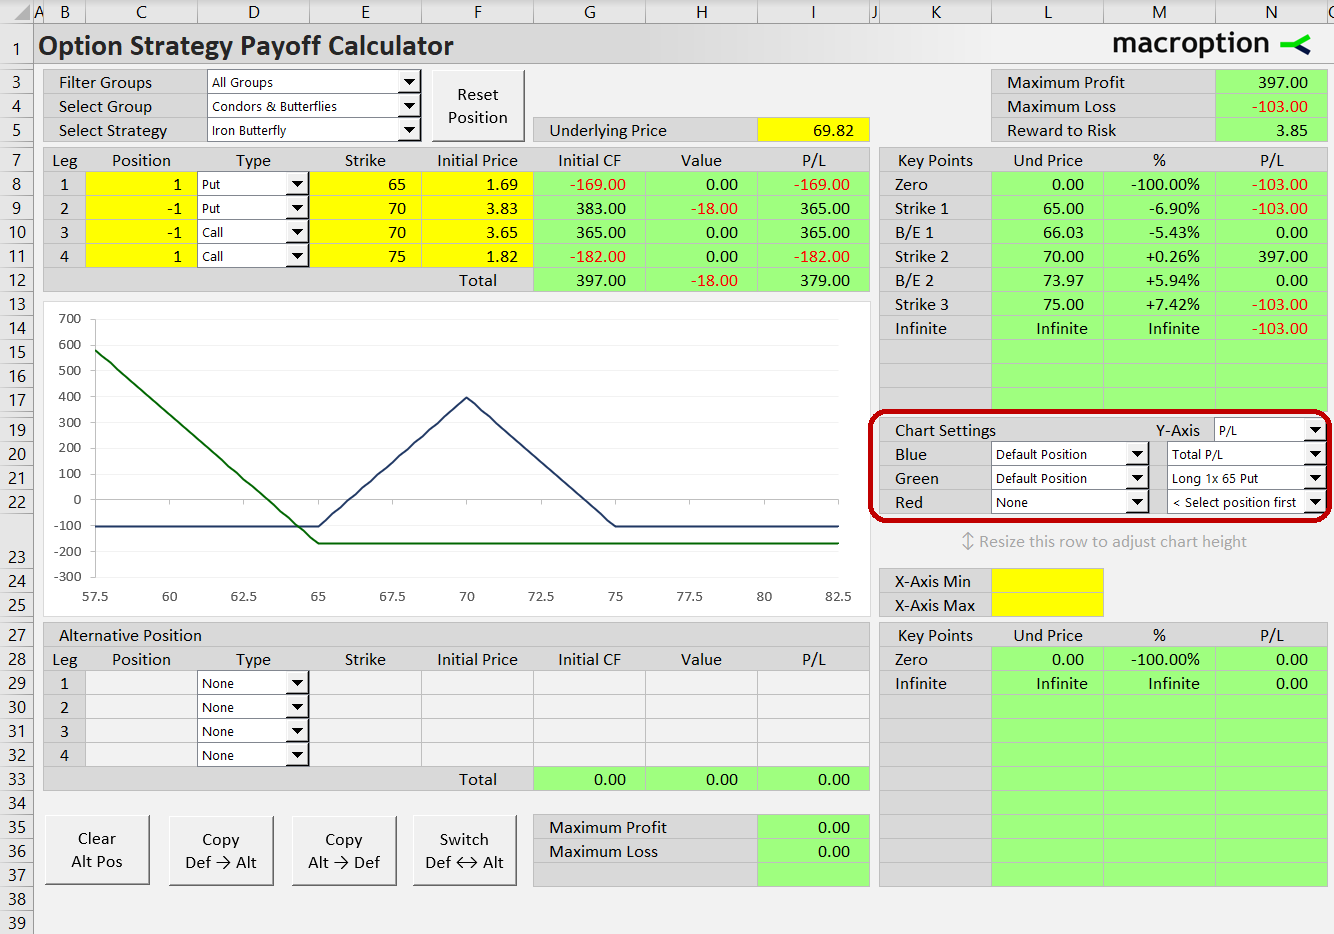
The risk profile is often best viewed visually on the profit graph. By default, the chart shows total profit or loss at expiration for the entire iron butterfly position. You can also display the contributions of individual legs by changing chart settings on the right side (cells K19-N22).
For instance, the screenshot below shows how the long 65-strike put leg (green line) contributes to total iron butterfly profit or loss (blue line).
Strike Selection
The chart can display payoff diagrams for two different positions, allowing you to model iron butterfly variants with different strikes and see how strike selection changes the risk profile.
The second variant is entered as "Alternative Position" below the chart in the same way as the default position is. For faster setup you can use the buttons at the bottom, which allow you to quickly copy one position's settings to the other or switch the two positions.
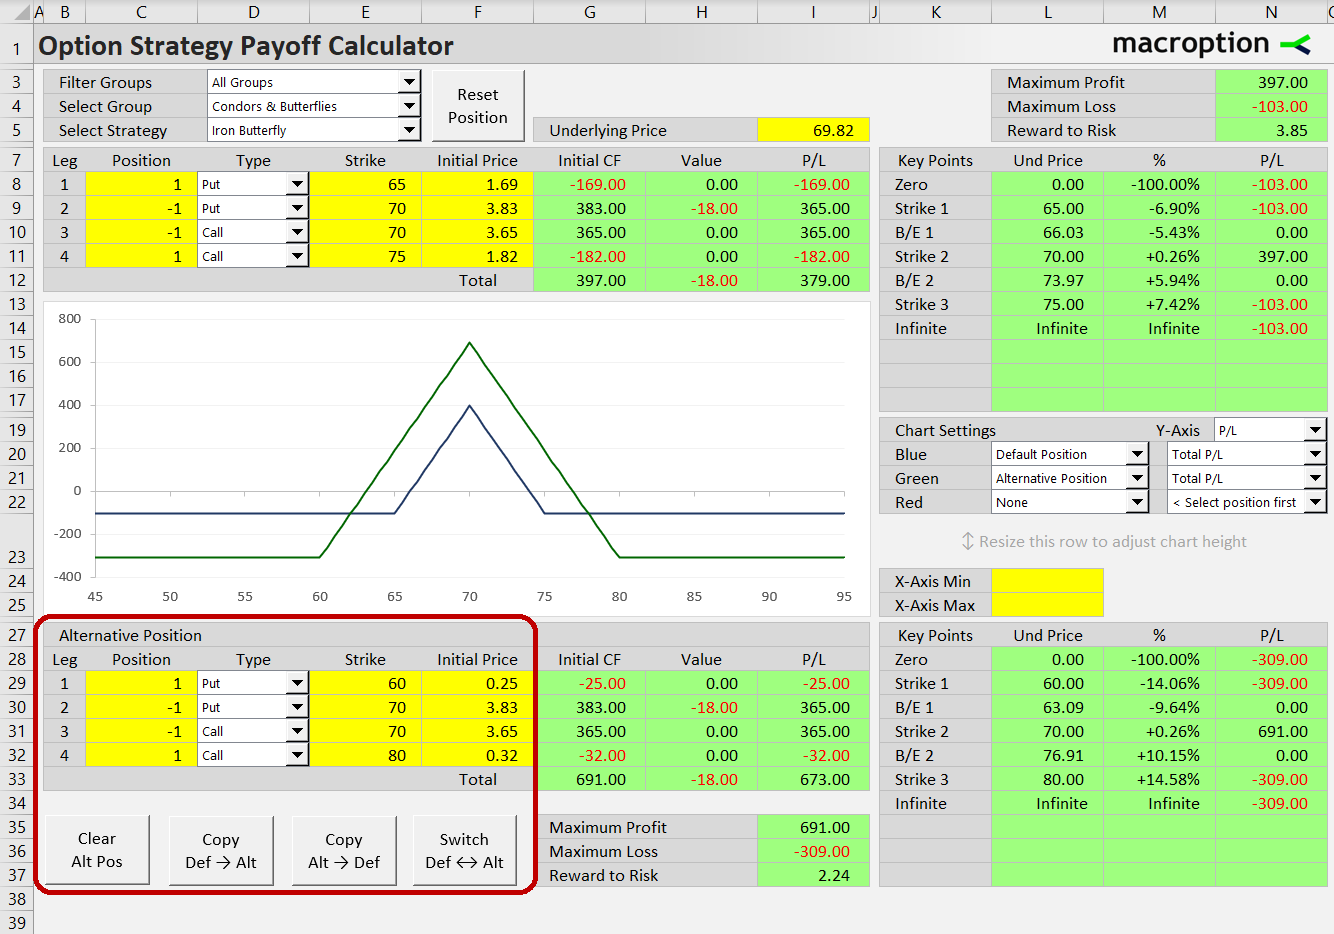
The screenshot above compares two iron butterfly positions, one with strikes 65-70-75 (Default Position, top, blue line) and the other with strikes 60-70-80 (Alternative Position, bottom, green line). In the bottom right corner you can see the same risk profile statistics, including maximum profit and loss, risk-reward ratio, and break-even points, for the alternative position.
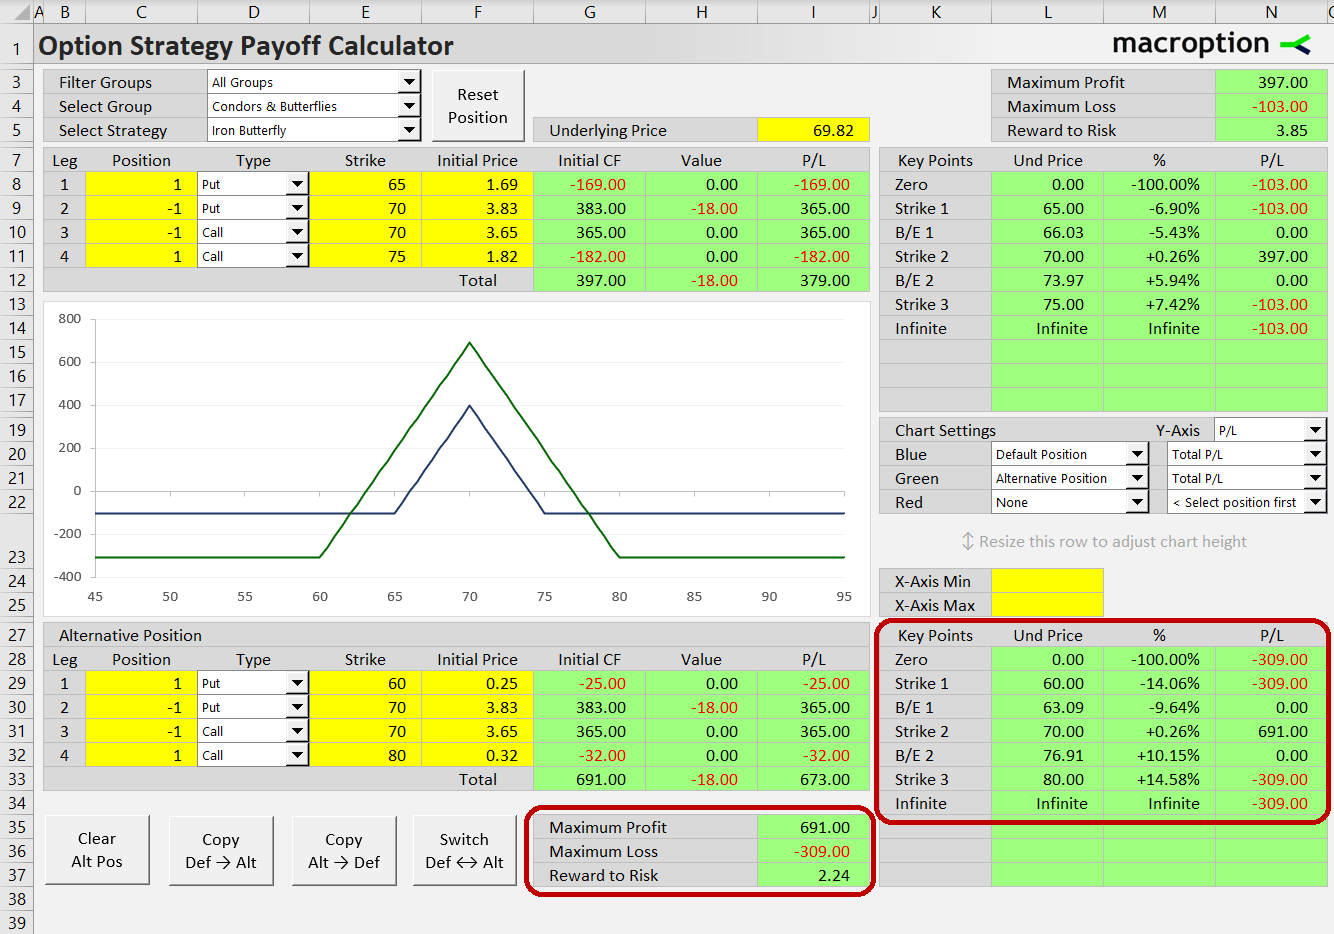
In this particular example, choosing more distant strikes for the long call and long put has increased both maximum profit (cell I35) and maximum loss (cell I36). Risk-reward ratio (cell I37) is slightly worse compared to the default 65-70-75 strike position (cell N5), but the window of profit is much wider (break-even points in rows 30 and 32 in columns K-N).
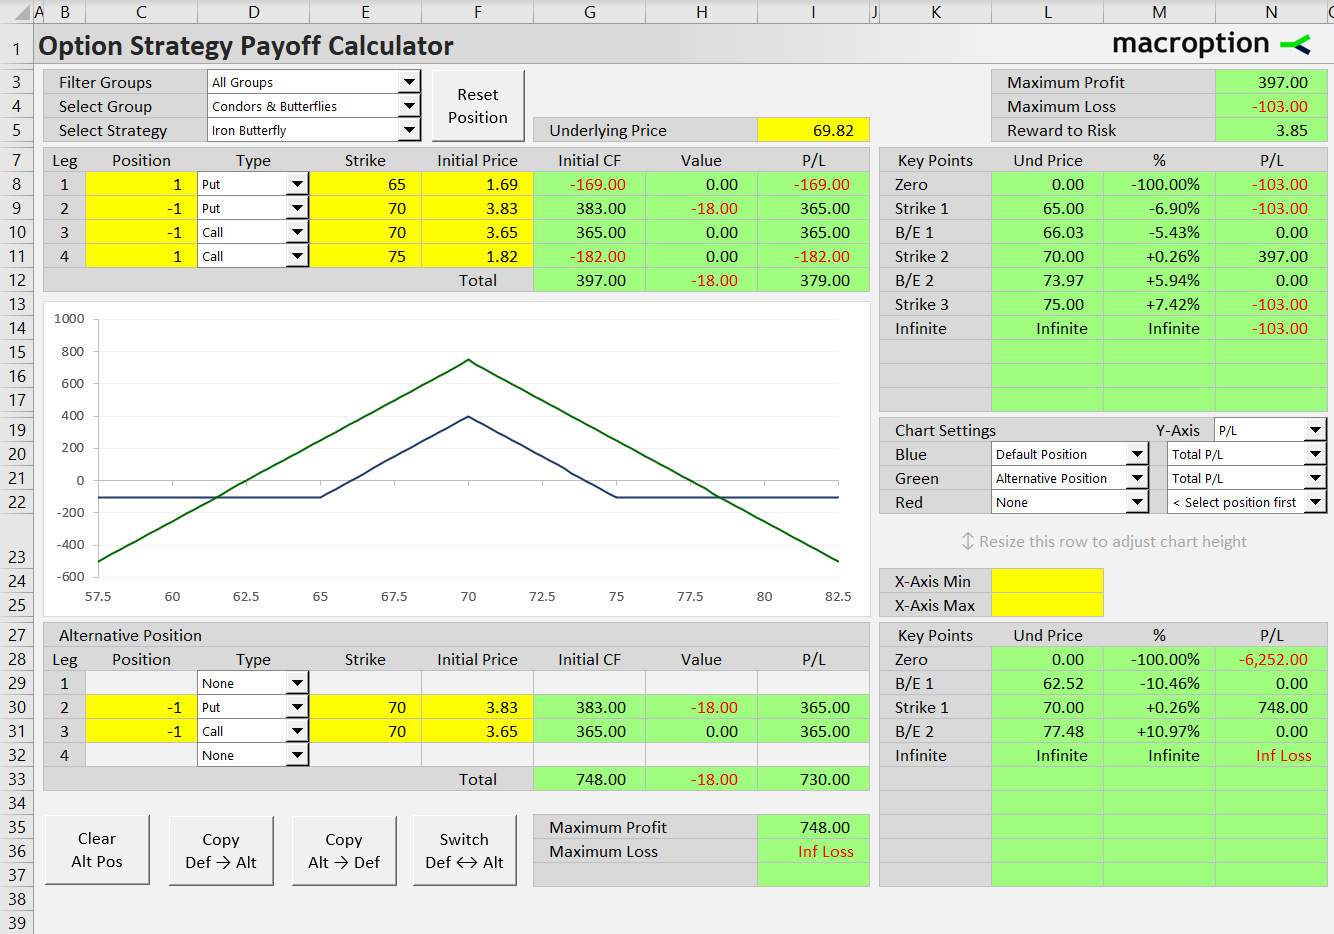
Iron Butterfly vs. Short Straddle
Alternatively, you can compare iron butterfly to an entirely different option strategy. For instance, you can display iron butterfly alongside short straddle and see how much you are giving up in maximum profit for the downside hedge that iron butterfly provides relative to short straddle.
Iron Butterfly vs. Iron Condor
Similarly, you can compare iron butterfly to iron condor, which has a gap between the middle short strikes and therefore a wider window of maximum profit (you can see how far the maximum profit boundaries and break-even points are in column M).
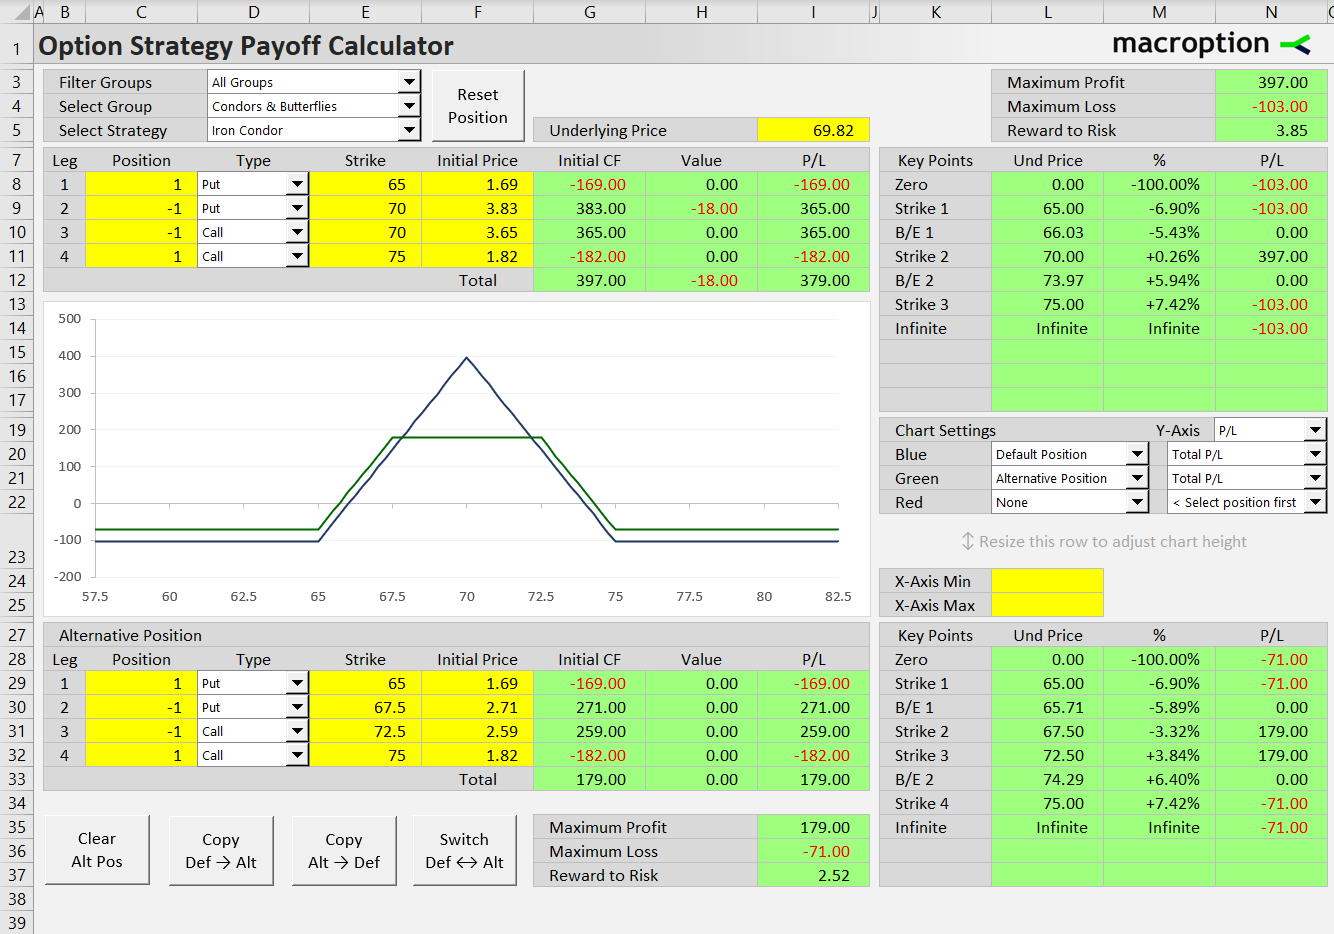
The tradeoff is that maximum profit is typically lower for iron condor compared to an otherwise similar iron butterfly - the risk profile statistics in the calculator allow you to quantify this tradeoff.