This page explains the logic and calculation of call option profit/loss at expiration, payoff diagram, and break-even.
See the same for short call (inverse position) and for put option.
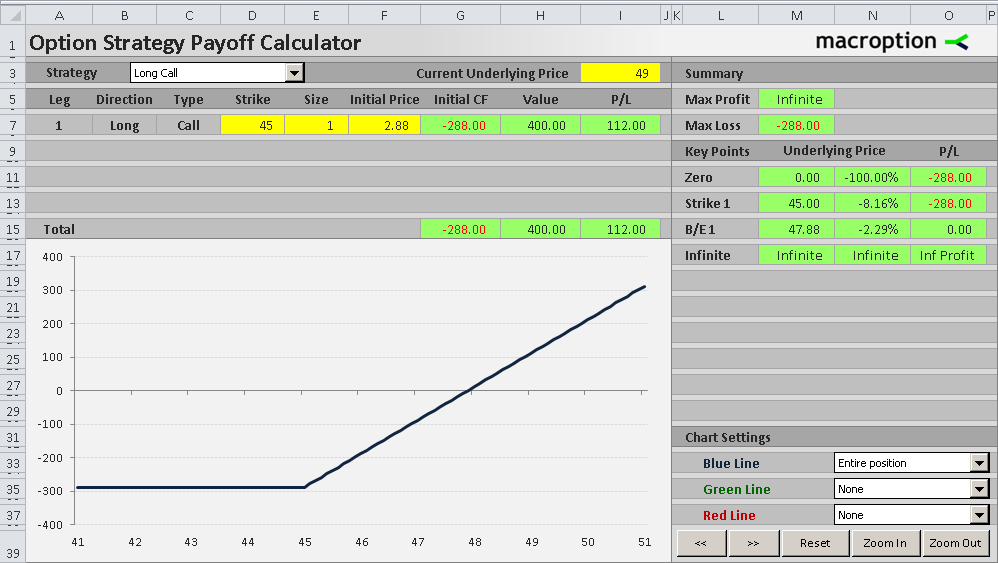
Call Option Payoff Diagram
Buying a call option is the simplest of option trades. A call option gives you the right, but not obligation, to buy the underlying security at the given strike price. Therefore a call option's intrinsic value or payoff at expiration depends on where the underlying price is relative to the call option's strike price.
The payoff diagram shows how the option's total profit or loss (Y-axis) depends on underlying price (X-axis).
The key variables are:
- Strike price (45 in the example above)
- Initial price at which you have bought the option (2.88 in the example)
- Current underlying price (the chart's X-axis)
As you can see in the graph, the option's strike price (45.00) is the key point which divides the payoff function in two parts. Below the strike, the payoff chart is constant and negative (the trade is a loss). Above the strike the line is upward sloping, as the call option's payoff is rising in proportion with the underlying price. At some point (the break-even point = 47.88 in our example) the line crosses zero and the trade starts to be profitable.
Call Option Scenarios and Profit or Loss
Three things can generally happen when you are long a call option.
1. Underlying price is lower than strike price
When underlying price ends up below the strike at expiration, the option expires worthless and your total result from the long call trade is a loss equal to the initial price (in this case $2.88 per share, or $288 for a standard option contract representing 100 shares). For example, if underlying price is 43.80, it makes no sense to exercise the option, which would only allow you to buy the underlying at 45.00, more expensively than on the market.
The good thing with a long call trade is that your loss is always limited to the initial cost - you can't lose more, no matter what happens. If the underlying price falls to zero, you still only lose the $288 which you paid for the call option in the beginning. A long call option's payoff chart is a straight line between zero and strike price and the payoff is a loss equal to the option's initial cost.
2. Underlying price is equal to strike price
In the rare case when the underlying price ends up being equal to the option's strike price at expiration, it still doesn't make any sense to exercise the option, because you may as well buy the underlying on the market for the same price. Therefore a long call option's payoff is still a loss equal to the initial cost ($288 in our example). Same as scenario 1 in fact.
3. Underlying price is higher than strike price
Finally, this is the scenario which a call option holder is hoping for. If the underlying price ends up being higher than the option's strike price, the option is in the money and it starts to make sense to exercise it.
For example, let's say the underlying price is 49.00. Because the option gives you the right to buy the underlying at strike price (45.00) and you can immediately sell it on the market at the underlying price (49.00), exercising the option brings you positive cash flow of $4.00 per share, or $400 per contract. If you bought the option at 2.88 (initial option price in our example), your profit from the entire trade would be 4.00 - 2.88 = $1.12 per share = $112 per contract. You can also see this in the payoff diagram where underlying price (X-axis) is 49.
Call Option Payoff Formula
The total profit or loss from a long call trade is always a sum of two things:
- Initial cash flow
- Cash flow at expiration
Initial cash flow
Initial cash flow is constant - the same under all scenarios. It is a product of three things:
- The option's price when you bought it
- Number of option contracts you have bought
- Number of shares per contract
Usually you also include transaction costs (such as broker commissions).
In our example, initial option price (including commissions) is $2.88 per share, we are long 1 contract of 100 shares, therefore initial cash flow is:
2.88 x 1 x 100 = - $288
Of course, with a long call position the initial cash flow is negative, as you are buying the options in the beginning.
Cash flow at expiration
The second component of a call option payoff, cash flow at expiration, varies depending on underlying price. That said, it is actually quite simple and you can construct it from the scenarios discussed above.
If underlying price is below than or equal to strike price, the cash flow at expiration is always zero, as you just let the option expire and do nothing.
If underlying price is above the strike price, you exercise the option and you can immediately sell it on the market at the current underlying price. Therefore the cash flow is the difference between underlying price and strike price, times number of shares.
CF = what you sell the underlying for - what you buy the underlying for when exercising the option
CF per share = underlying price - strikes price
CF = ( underlying price - strike price ) x number of option contracts x contract multiplier
In our example with underlying price 49.00:
CF = ( 49 - 45 ) x 1 x 100 = $400
Putting all the scenarios together, we can say that the cash flow at expiration is equal to the greater of:
- ( underlying price - strike price ) x number of option contracts x contract multiplier
- Zero
If you are using Excel, you can calculate this using the MAX function.
Note: The option's value or cash flow at expiration is equal to the option's intrinsic value. It is the same formula.
Putting it all together - call option payoff formula
Call P/L = initial cash flow + cash flow at expiration
Initial CF = -1 x initial option price x number of contracts x contract multiplier
CF at expiration = ( MAX ( underlying price - strike price , 0 ) x number of contracts x contract multiplier
Call P/L = ( MAX ( underlying price - strike price , 0 ) - initial option price ) x number of contracts x contract multiplier
Call P/L per share = MAX ( underlying price - strike price , 0 ) - initial option price
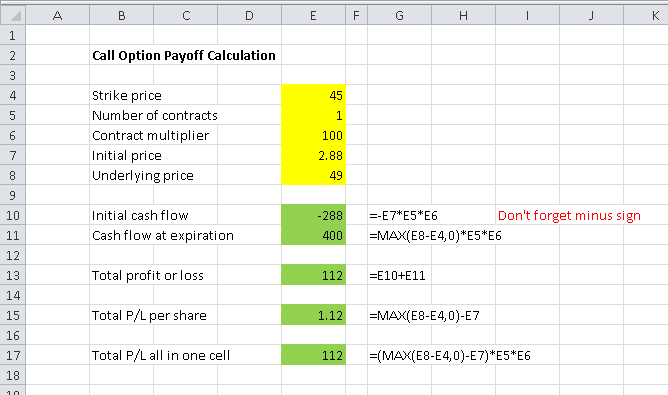
Call Option Payoff Calculation in Excel
The screenshot below illustrates call option payoff calculation in Excel. Besides the MAX function, which is very simple, it is all basic arithmetics.
Call Option Break-Even Point Calculation
One other thing you may want to calculate is the exact underlying price where your long call position starts to be profitable. In other words, the point where the payoff chart crosses the zero line, or where the total P/L (which we have calculated above) equals zero - the break-even point.
It is very simple. It is the sum of strike price and initial option price.
Call B/E = strike price + initial option price
In our example with strike = 45 and initial price = 2.88 the break-even point is 47.88. You can try to use this as underlying price in the P/L formula above and you will get exactly zero profit.
Long Call Option Payoff Summary
- A long call option position is bullish, with limited risk and unlimited upside.
- Maximum possible loss is equal to initial cost of the option and applies for underlying price below than or equal to the strike price.
- With underlying price above the strike, the payoff rises in proportion with underlying price.
- The position turns profitable at break-even underlying price equal to the sum of strike price and initial option price.