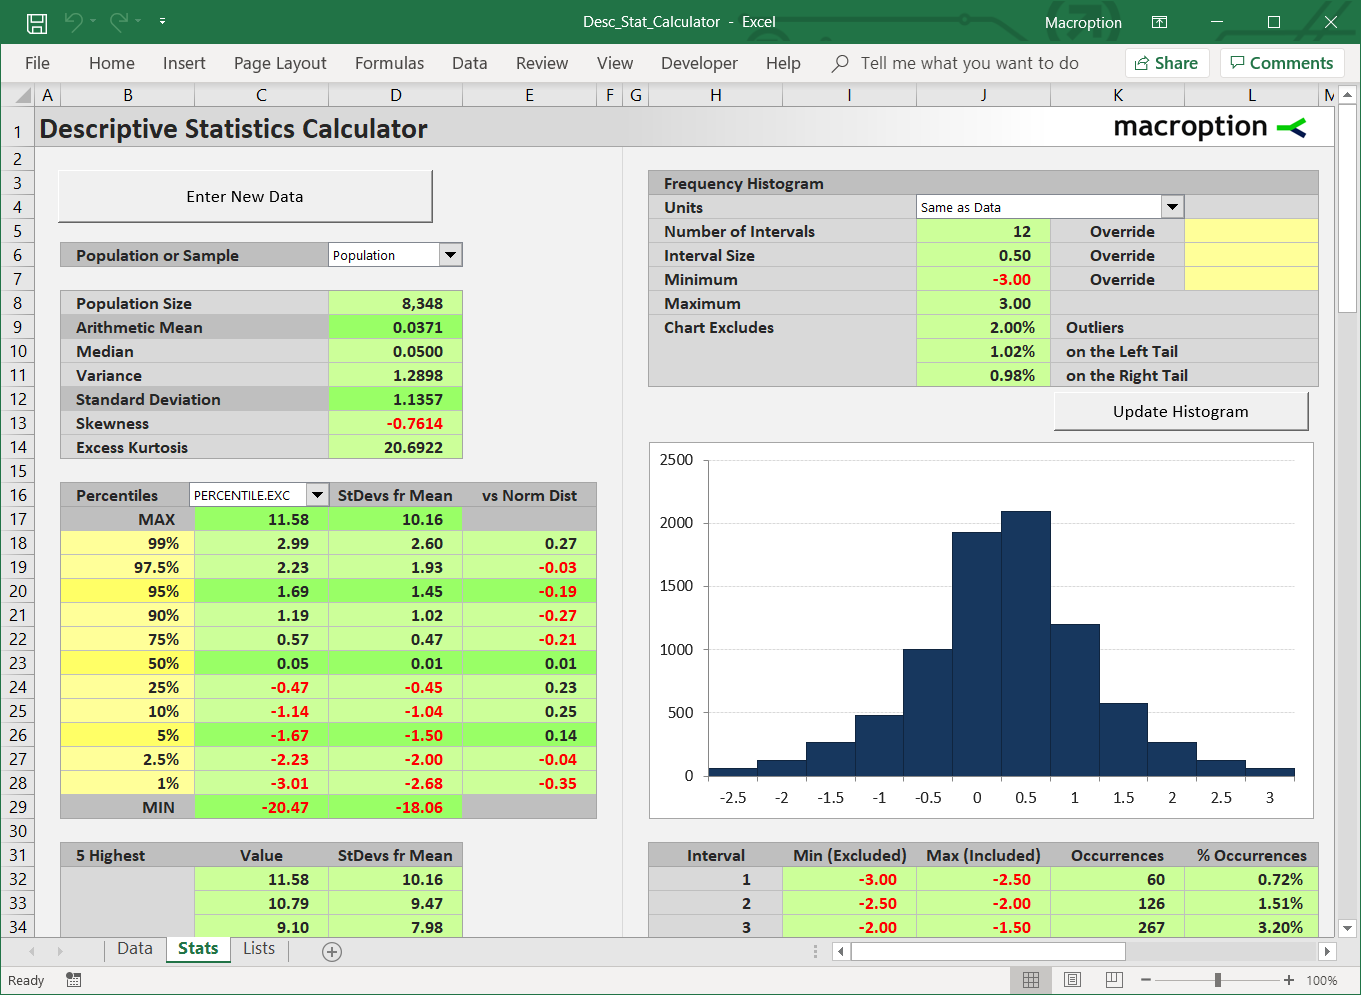
This page explains commonly used summary statistics (including mean, median, variance, standard deviation, skewness, kurtosis, and percentiles), which you can calculate in Excel using the Descriptive Statistics Calculator. Follow the links for more details concerning calculation and interpretation of individual measures.
Population or Sample Size (N)
Data set (sample or population) size is how many observations (values or items) there are, or how many values you use to calculate all the summary statistics. It is usually denoted as uppercase or lowercase N or n.
In Excel you can easily get it using the COUNT function. In the Descriptive Statistics Calculator, data set size is in cell D8.

Arithmetic Mean
Arithmetic mean (which is the same thing as arithmetic average) is the most commonly known and used of all the summary statistics. It is what most people have in mind when they say "average", although there are other types of averages besides arithmetic mean.
Arithmetic average is calculated as the sum of all values divided by the data set size (N). In Excel, you can get arithmetic mean using the AVERAGE function. It is cell D9 in the Descriptive Statistics Calculator.
Simplicity of calculation and interpretation is one of the main advantages of arithmetic mean. However, there are also drawbacks. In some cases (for example when there are extreme values in the data set), other measures tell a better story about the data (one of them is median).
More about arithmetic average:
- How to Calculate Arithmetic Average
- Arithmetic Average Advantages and Disadvantages
- Arithmetic Average: When to Use It and When Not
Median
Median often complements arithmetic mean as a measure of central tendency (average or most "typical" value) of a data set.
Median is the value which is greater than half of all the other values and smaller than the other half. If you sort all the values in a data set from smallest to greatest, median is ranked exactly in the middle.
Unlike most of the other statistics, there is no simple formula to calculate median, but there is a relatively simple algorithm: First, rank all the values. Then find the value which is in the middle of the ranked values.
In Excel, there is a function: MEDIAN. In the Descriptive Statistics Calculator is in cell D10.
You can see more detailed explanation of median and its calculation here:
Variance and Standard Deviation
Variance is a measure of dispersion or variability in the data. It is defined as the average squared deviation from the mean and therefore (due to the squared part) it is always non-negative.
Low variance is interpreted as little variability in the data set (the values tend to be very similar, like 80, 81, 78, 80), while high variance indicates a very diverse data set with big differences in individual values (like 80, 5, 147, 34).
Standard deviation is directly derived from variance. In fact, standard deviation is the square root of variance.
Variance vs. Standard Deviation Units and Use
While both variance and standard deviation measure the same thing, the latter tends to be better known and more widely used. For example, in finance, volatility is usually expressed as standard deviation.
The main reason and the greatest advantage of standard deviation is that it is measured in the same units as the underlying data, while variance is measured in the units squared.
For example, standard deviation of a set of prices is measured in dollars, while variance is measured in dollars squared.
Similarly, standard deviation of investment returns (historical volatility) is measured in percent, while variance is in percent squared.
That said, variance still has a wide range of uses, in finance and other areas. It is particularly useful for various tests and analyses (e.g. Analysis of Variance – ANOVA) or as an input for calculation of other measures or indices. Not having to deal with the square root can be a significant advantage in more complex calculations.
Variance and Standard Deviation Calculation
The exact calculation of variance and standard deviation is slightly different depending on the data set being a sample or population.
The respective Excel functions are VAR.S, VAR.P, STDEV.S, and STDEV.P. Variance is in cell D11 and standard deviation in D12 in the Descriptive Statistics Calculator. You can set whether your data set is sample or population in the dropdown box in cell D6.

Here you can see more detailed explanation of variance and standard deviation and their calculation:
- Calculating Variance and Standard Deviation in 4 Easy Steps
- Population vs. Sample Variance and Standard Deviation
Skewness
Skewness measures the symmetry of the distribution. Most importantly, it compares relative frequency of extreme low (left tail) and extreme high (right tail) values.
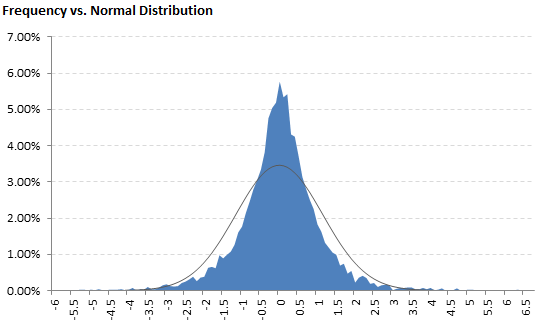
Normal distribution, which is perfectly symmetric, has skewness of zero. Positive skewness means that extremely high values are relatively more common (right tail is fat), while negative skewness means that extremely low values are more common (left tail is fat).
In finance and investing (and even more so in options pricing and trading), knowing skewness of return distributions is very useful, as it may indicate frequency or probability of extremely large gains and (more importantly) losses.
The calculation of skewness may look complicated at first, but as soon as you get the underlying logic, it is quite straightforward. It is not unlike calculating variance and standard deviation. Skewness too has slightly different formula for population and sample. Here you can see a detailed explanation and derivation of skewness formula.
In Excel, you can calculate sample skewness using the built-in SKEW function. There is no built-in function for population skewness, but you can easily calculate it through a small adjustment of the SKEW function (see how).
In the Descriptive Statistics Calculator skewness is in cell D13.
Kurtosis
Kurtosis measures how fat tails the distribution has. High kurtosis means that there are many extreme values far from the mean to either side; low kurtosis means extreme values are relatively less common.

Kurtosis is often quoted in the form of excess kurtosis, which equals kurtosis less 3. The lowest possible value of excess kurtosis is negative 2; the highest is infinite. Normal distribution has excess kurtosis equal to zero. This is why excess kurtosis is often used rather than basic kurtosis – excess kurtosis is the kurtosis relative to, or in excess of, normal distribution kurtosis.
As with skewness, there is a small difference in calculation of population and sample kurtosis. See detailed explanation of formulas for sample and population kurtosis and excess kurtosis.
In Excel, the function for sample excess kurtosis is KURT. There is no built-in Excel function for population kurtosis (you need to calculate it manually by adjusting from KURT – see how).
You can calculate either population or sample excess kurtosis in the Descriptive Statistics Calculator in cell D14.
Percentiles
Percentiles are used to describe the structure of the data in greater detail. They use the same logic as median (above on this page), which in fact is the 50th percentile, as there are 50% values in a data set greater and 50% values smaller than median. Analogically, for 5th percentile there are 95% values greater and 5% smaller, for 99% percentile there are 1% values greater and 99% smaller.
Generally, for Nth percentile there are 1-N% values greater and N% values smaller.
The Excel functions for percentiles (exclusive or inclusive) are PERCENTILE.EXC and PERCENTILE.INC.
In the Descriptive Statistics Calculator, percentiles are in cells C18-C28.
Minimum and Maximum Value
The extreme values – minimum and maximum provide a very useful information that the other summary statistics don't. In many cases (and especially in finance and investing), it is very useful to know the actual smallest and largest value (e.g. portfolio return in a period). Nevertheless, if your data set is only a sample (e.g. past returns), you should still be prepared for the population (which also includes unknown future returns) to contain even more extreme values.
In Excel, the functions are MIN and MAX. In the Descriptive Statistics Calculator, maximum value is at the top of the percentiles table (cell C17) and minimum at the bottom (cell C29).
Descriptive Statistics Calculator
You can find screenshots and download the calculator here.