This page demonstrates how to enter the strike price input in the Black-Scholes Calculator and how to draw charts showing effects of strike selection on option prices and Greeks.
Entering Strike Price Input
Strike price is one of the six inputs required for option price calculation under the Black-Scholes model (the others are underlying price, volatility, interest rate, dividend yield, and time to expiration). All the inputs are set in the yellow cells in the upper left corner of the main sheet.
Enter strike price in the yellow cell C6.

Setting Strike Price Charts
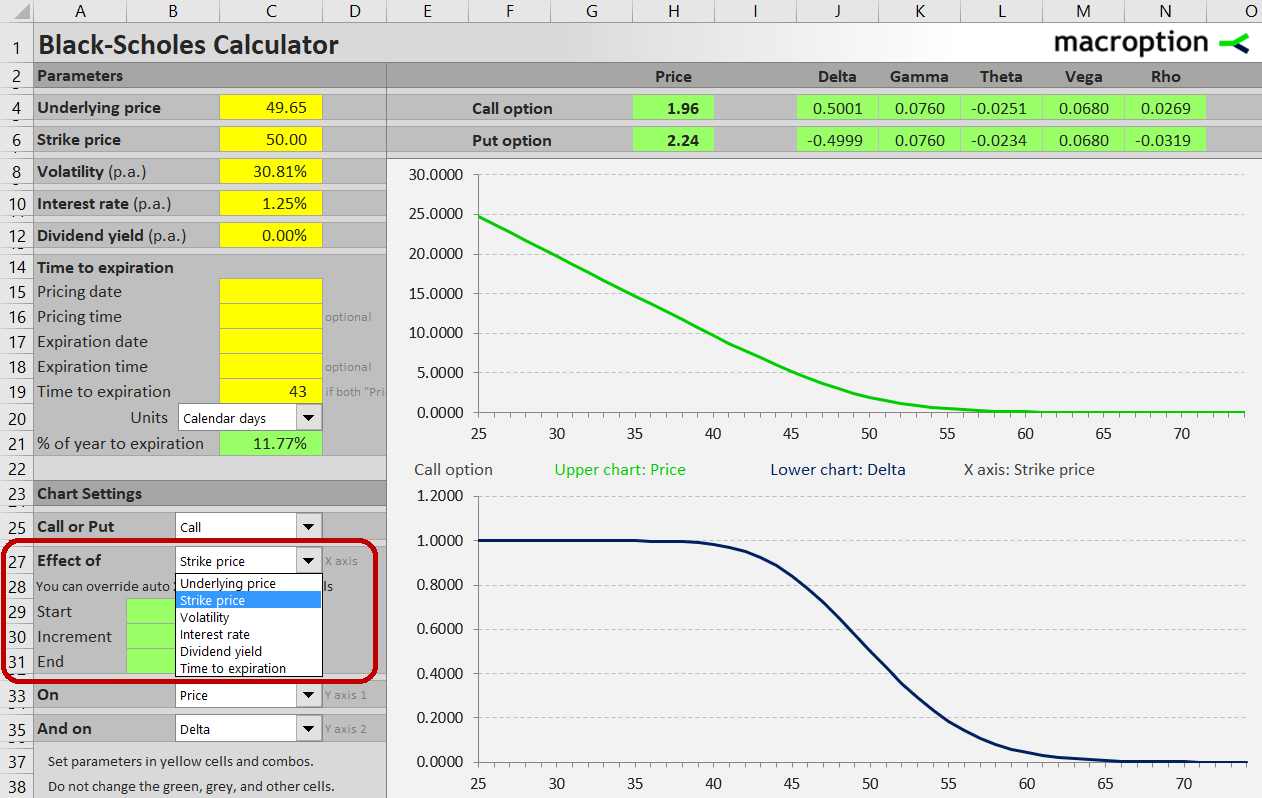
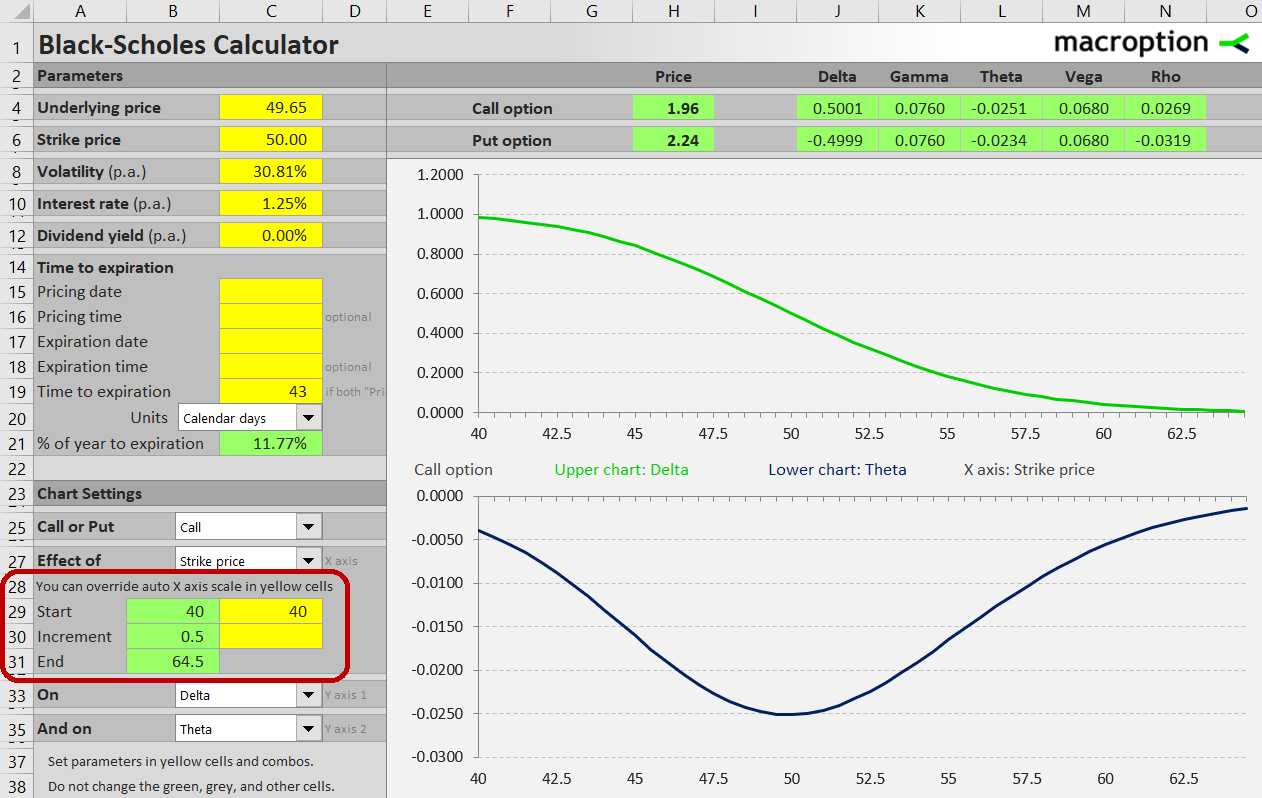
The calculator can model effects of strike price selection on call or put option prices or any of the Greeks. To display a strike price chart, select "Strike price" in the dropdown box in cell C27. This selection decides which of the inputs will the on the X-axis, which is the same for both charts.
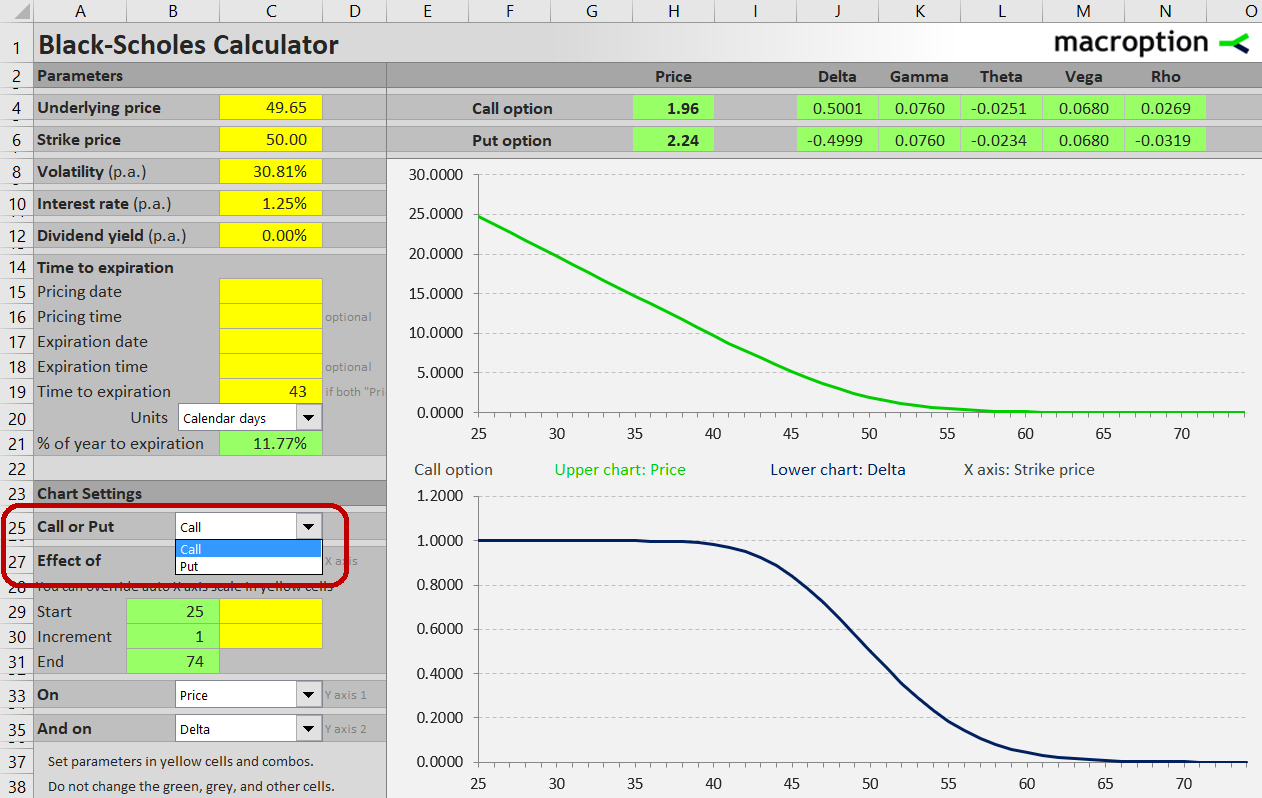
In the combo box in cell C25, select if you want to see the charts for a call or put option.
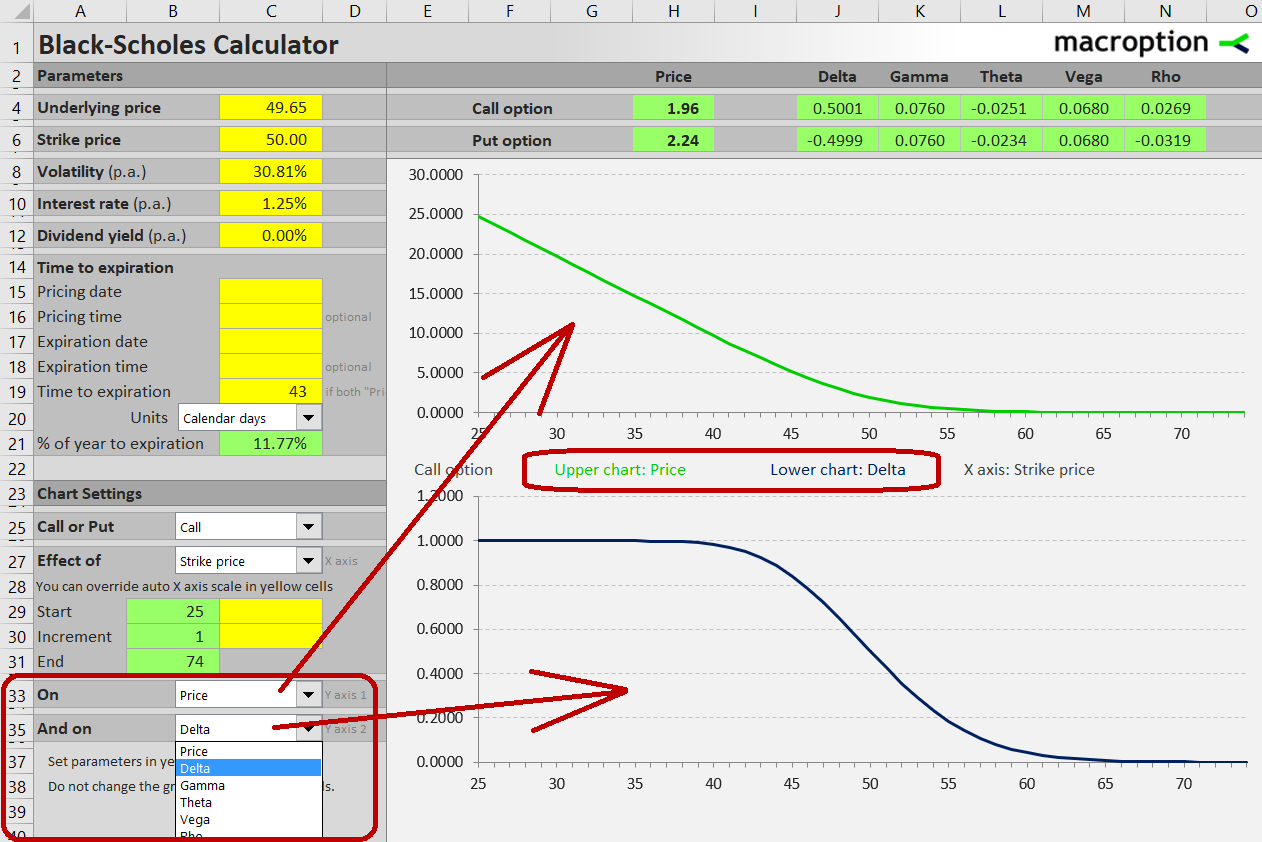
There are two charts (the upper chart with green line and lower chart with blue line). Both share the same X-axis and can display different values (option prices or the individual Greeks) on the Y-axes. To select each chart's Y-axis, use the combo boxes in cells C33 and C35.
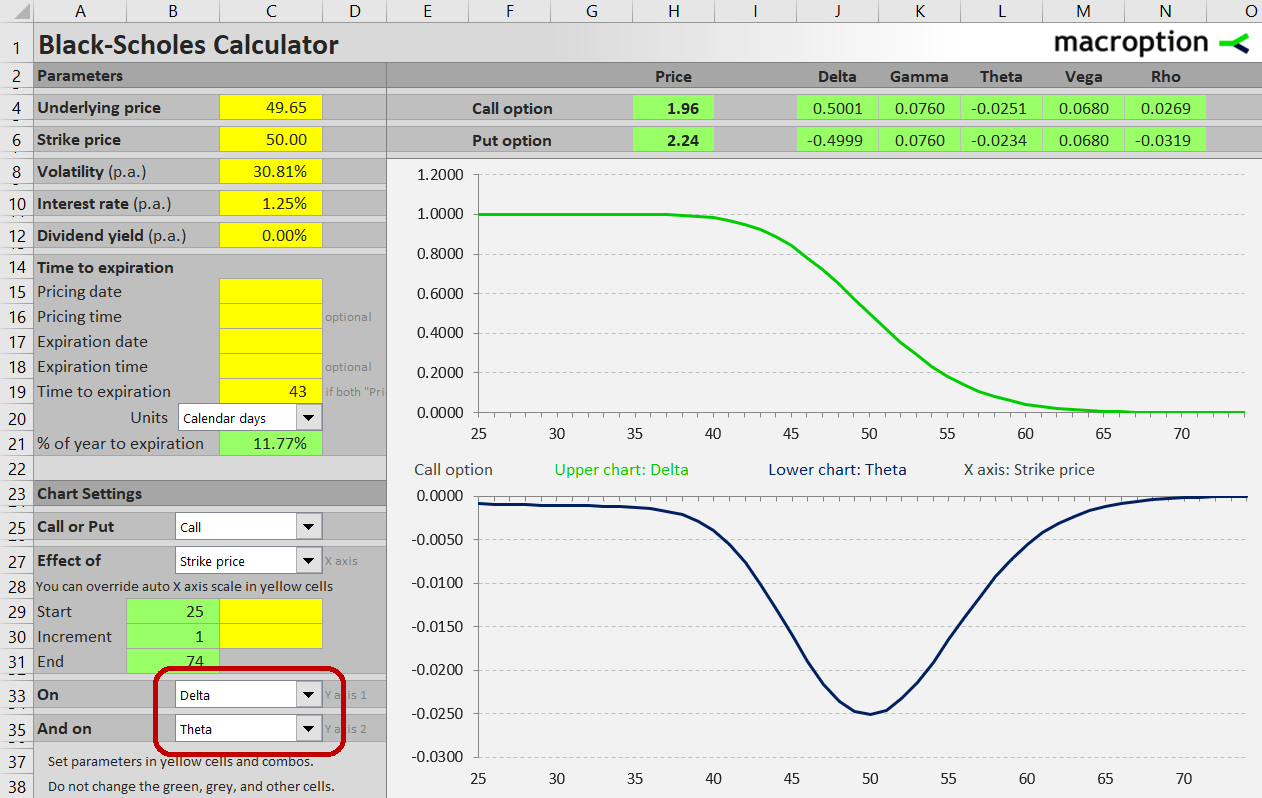
For example, you can select the upper chart to display delta for each strike and the lower chart to display theta for the same strikes. This can be useful when deciding which strike to use for a particular trade and allow you to consider both the option's sensitivity to underlying price changes (delta) and the speed of time decay (theta) at the same time.
The chart's scale is automatically calculated to cover the entire range of realistically possible strikes and show markers at round numbers. If you want to zoom in and explore a smaller area in more detail, you can override the automatic X-axis range in the yellow cells C29 (chart start – lowest strike displayed) and C30 (increment).
More Information
Detailed instructions for using all the calculator's features are available in the user guide.
For more screenshots and overview of all features, see Black-Scholes Calculator main page.
If you have any questions, please feel free to ask.