This page explains how to enter the underlying price input in the Black-Scholes Calculator and how to set up charts modeling the effects of underlying price on option prices and Greeks.
Entering Underlying Price Input
In order to calculate option prices, you need to set all the inputs for the Black-Scholes option pricing model: underlying price, strike price, volatility, interest rate, dividend yield, and time to expiration.
Underlying price is entered in the yellow cell C4:

The price to use is typically the latest known price of the underlying security, which is a good representation of its current market value. For liquid underlyings you can use the last traded price, for illiquid ones use the average of bid and ask.
For stock and ETF options underlying price is typically entered as price per one share, in the same units as stock and option prices are usually quoted. For index options it is usually the index value. For futures options it is usually in the same units as the underlying futures contract is quoted.
It is possible to use other units, for example multiply underlying stock price by 100 to get price for 100 shares and enter that number in cell C4. The calculations will still work correctly, as long as you enter the strike price (cell C6) in the same units (i.e. also multiplied by 100 in this particular example). The resulting option prices in cells H4/H6 will then be shown as price for one contract of 100 shares in this case.
For general discussing about underlying price, its role in the Black-Scholes model, and its effect on call and put option prices, see Black-Scholes Underlying Price Input.
Delta and Gamma
In the green cells J4-K4 (for calls) and J6-K6 (for puts) you can see delta and gamma for the option with given inputs.

Delta measures the effect of underlying price changes on the option price. Mathematically, delta is the first derivative of option price with respect to underlying price. For example, delta of 0.6653 means that if underlying price rises by 1 dollar (from the current 26.20 to 27.20), the call option price (shown in cell H4) will increase approximately by 0.67 (approximately to 2.58).
The word approximately is very important. When you try to enter 27.20 as new underlying price in cell C4, you will realize that the option price actually increased to 2.63, with is a few cents higher than what delta would suggest. This is due to the convexity of option prices. Delta itself changes as underlying price changes; therefore the delta value 2.58 is valid only at underlying price 26.20 for infinitely small change in underlying price. As underlying price starts to rise, delta also increases and the option price increase is accelerating. Delta can be understood as the slope of option price chart (with underlying price on the X-axis) at a particular point. As underlying price changes and you move along the chart, the slope (delta) changes too.
This effect of underlying price changes on delta is measured by gamma. The gamma value is by how much delta will increase when underlying price rises by 1 dollar. Mathematically, gamma is the second derivative of option price with respect to underlying price, or the slope of a delta chart where underlying price is on the X-axis.
Modeling Effects of Underlying Price with Charts
Charts are very effective for better understanding of effects of individual inputs on option prices. The calculator allows you to display charts showing effect of any of the inputs on call or put option prices or any of the Greeks. There are two charts arranged vertically with the same X-axis, which allows you to plot effect of an input on two related things (e.g. option price and delta) at the same time.
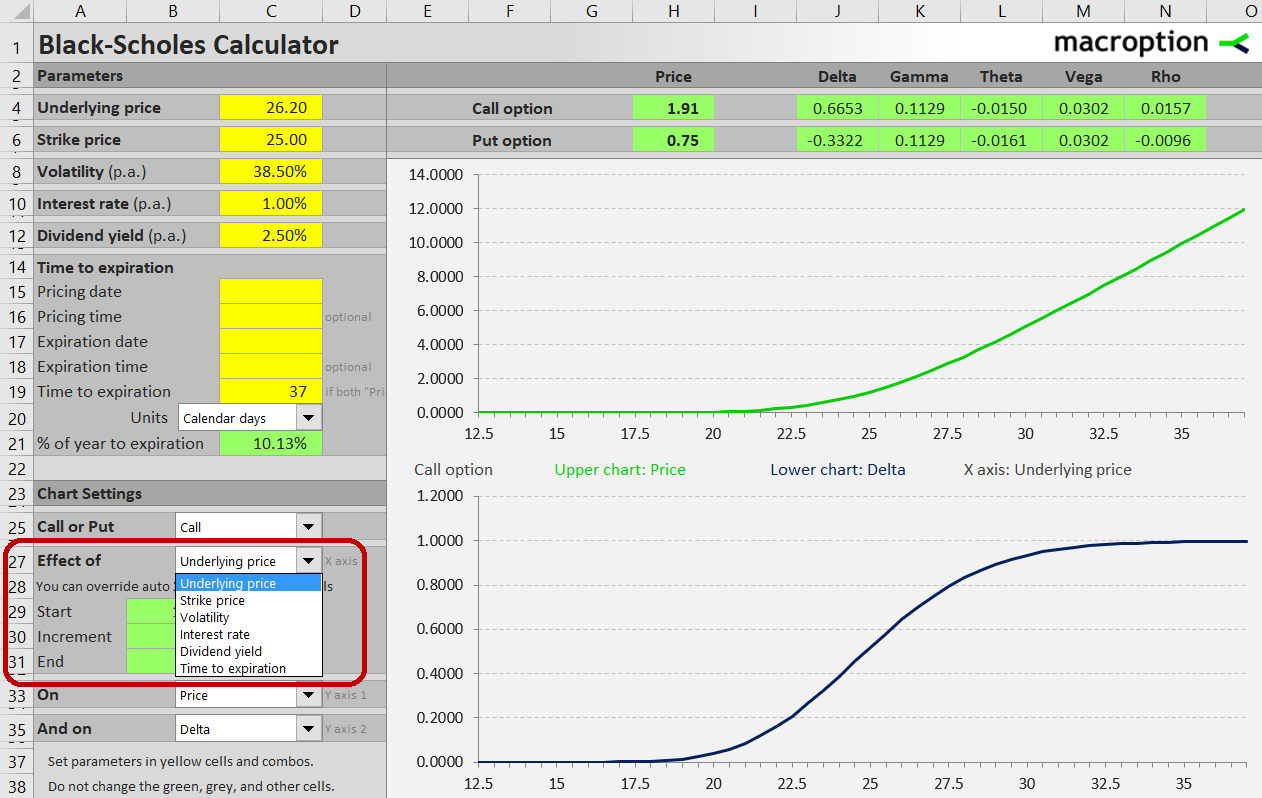
To model effects of underlying price, select it in the combo box in cell C27. Underlying price will be the X-axis in both charts:
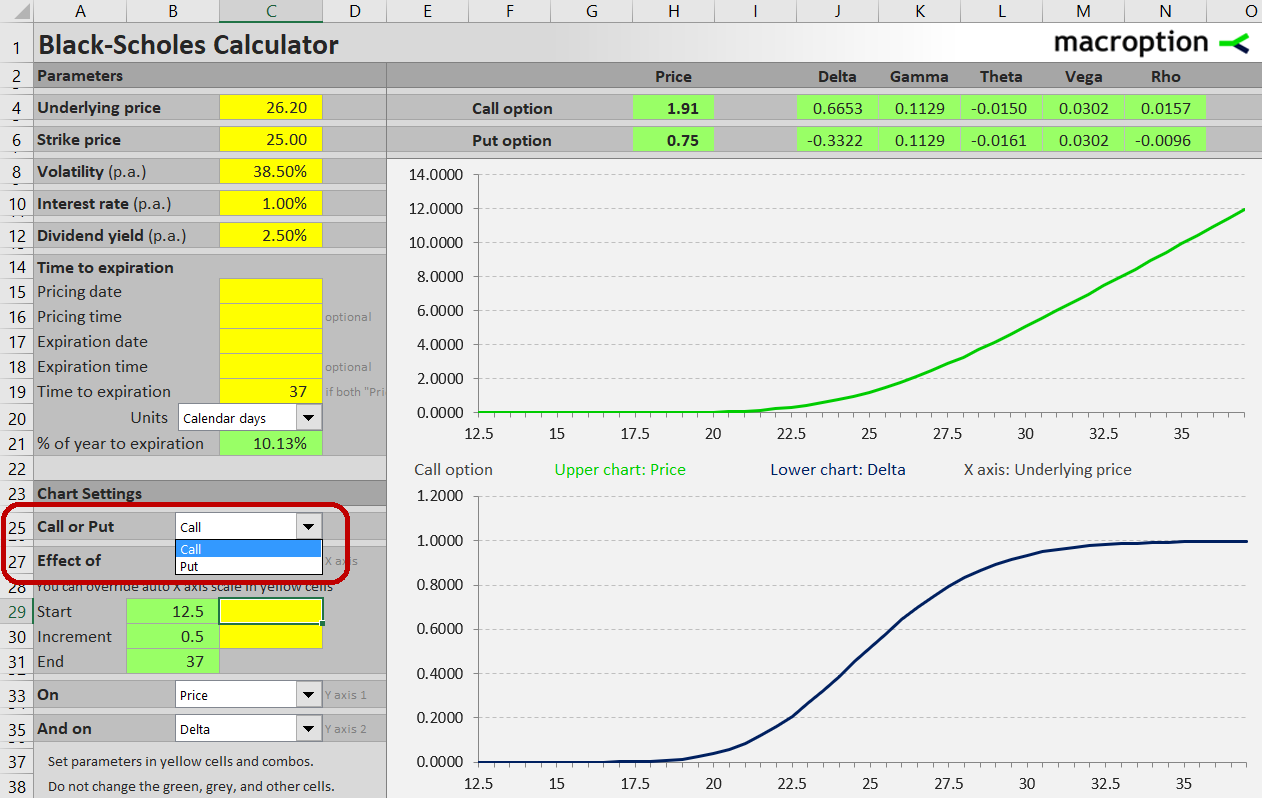
Select if you want to see charts for call or put option in the combo box in cell C25:
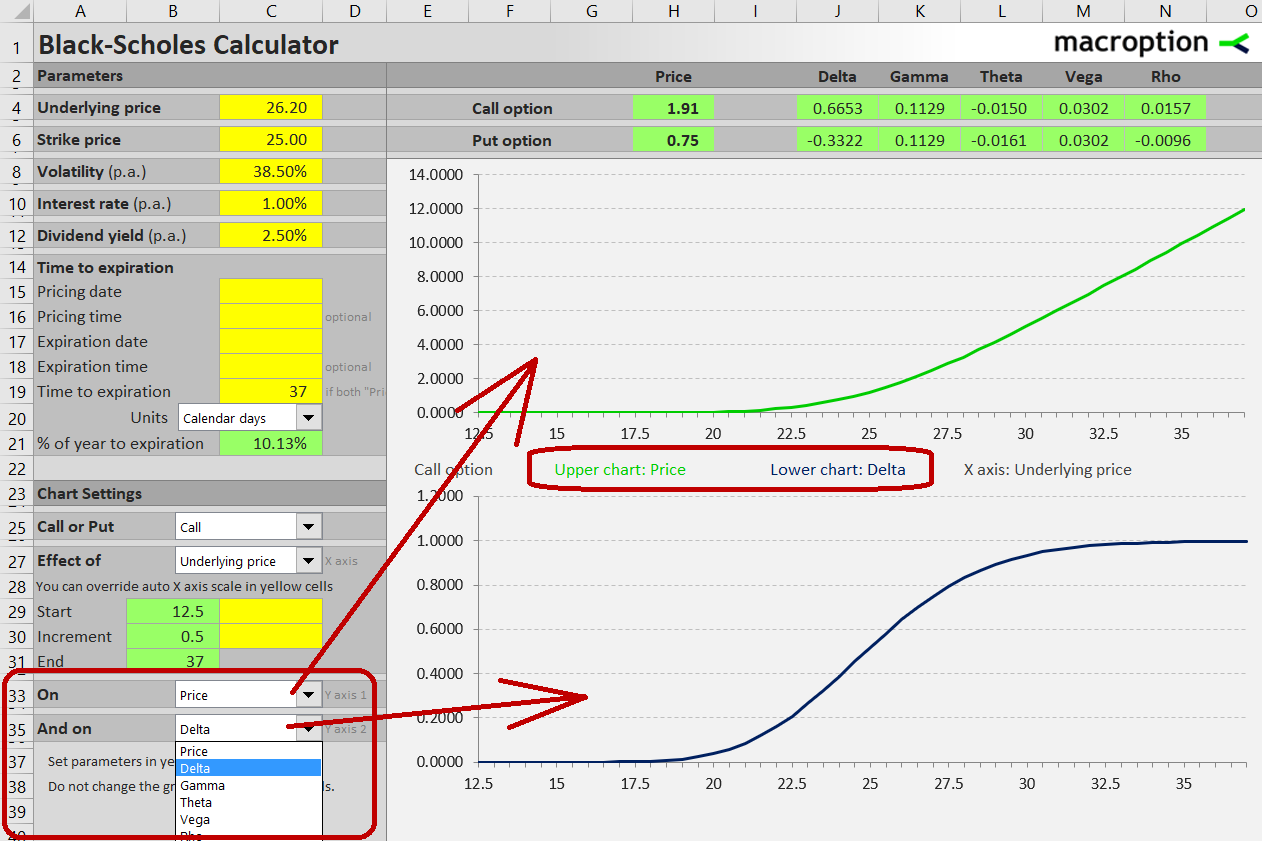
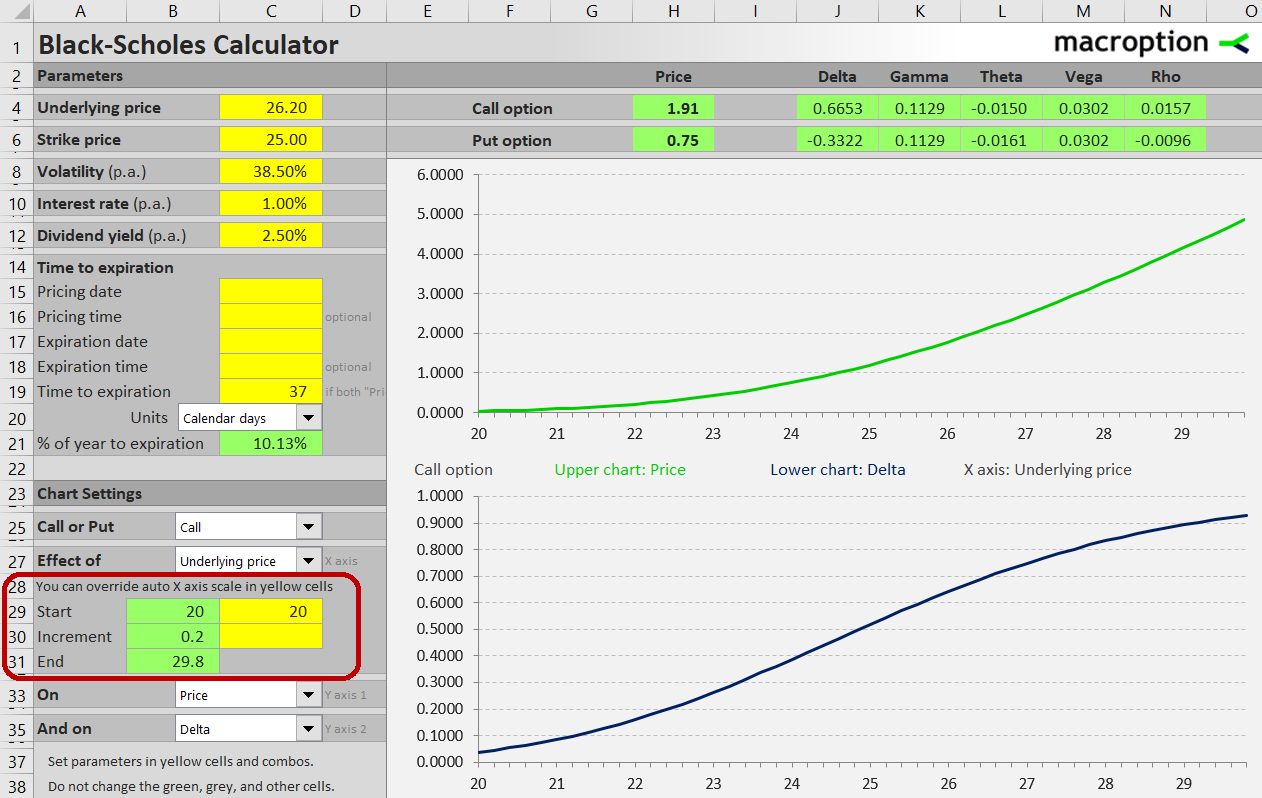
In the same way, in cells C33 and C35 you can choose what you want to see on each chart's Y-axis. For example, to display the effect of underlying price on the option's price in the upper chart, select "Price" in cell C33. To see the effect of underlying price on the option's delta in the lower chart, select "Delta" in cell C35:
You can choose any combination. For example, you can display the effect of underlying price on delta and gamma to better understand the convexity phenomenon.
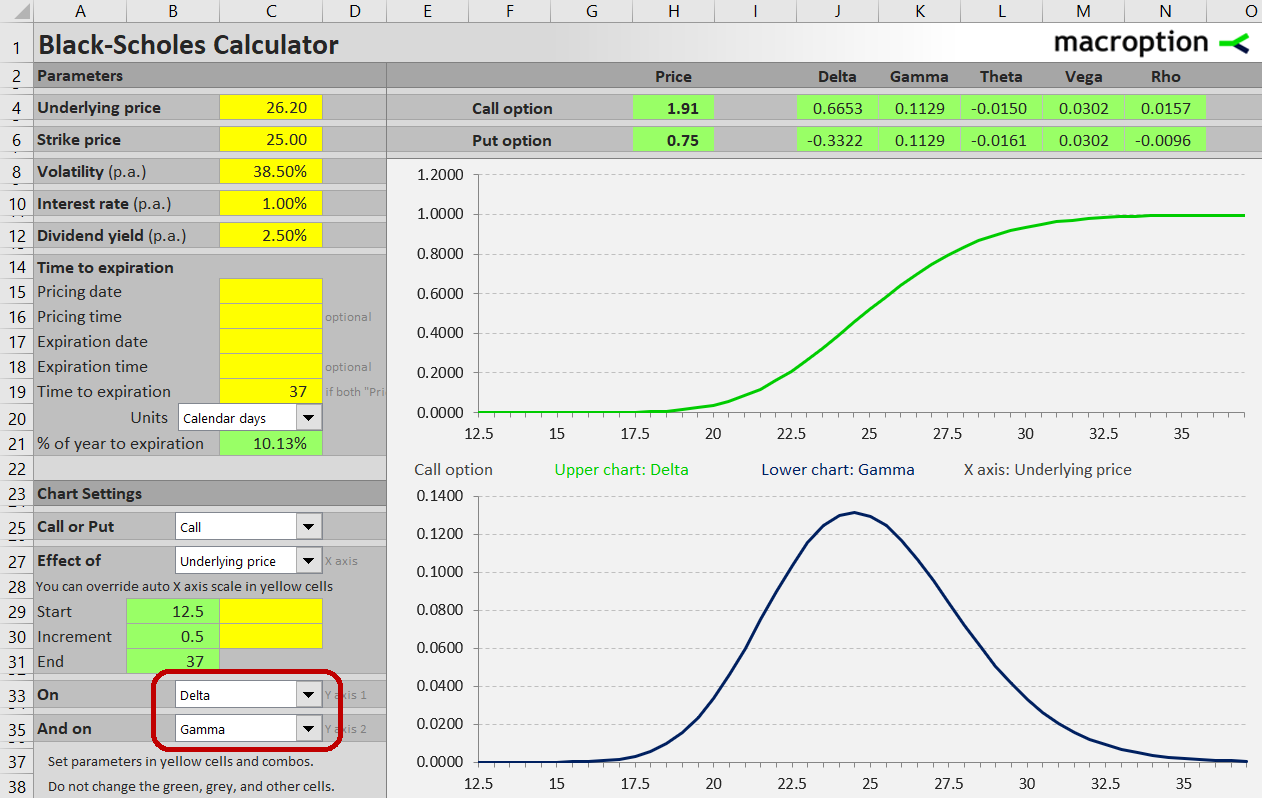
The chart's scales are calculated automatically based on the range of input and output values (these calclations are done in the "Auto X" sheet, which is usually of little interest to the end user). You can easily override the automatic X-axis scale in the yellow cells C29 (bottom of underlying price range to display) and C30 (increment). This way, you can zoom in to different points on the chart to study a particular area in more detail.
More Information
Detailed instructions are available in the calculator's user guide.
For more screenshots and overview of all the features, see Black-Scholes Calculator main page.
If you have any questions, please feel free to ask.