This page shows how to convert implied volatility (typically annual standard deviation of returns) to daily volatility and how to interpret it in terms of expected daily price changes with given probabilities.
To convert volatility between annual, daily, weekly, monthly, or custom periods, use the free online Volatility Period Converter. This page explains the background calculations.
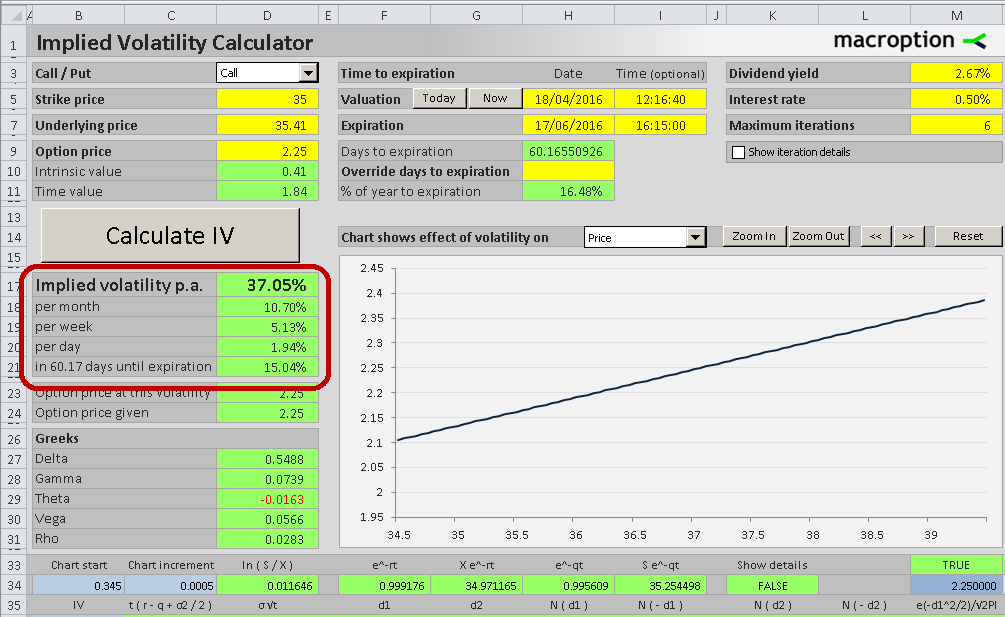
Note that in the Implied Volatility Calculator you don't need to do the conversion, as the calculated implied volatility is already shown for all the common time periods - annual, monthly, weekly, daily, and for the exact time period until the option's expiration (cells D17-D21).
Implied Volatility as Annual Standard Deviation
Implied volatility, either in the form of volatility index (such as the VIX for S&P500 index) or implied volatility for a single option (see how to calculate that from option price), is typically expressed as annualized standard deviation of the underlying asset's returns (price changes).
That said, it is often useful to work with volatility or expected price changes over a period shorter than one year. You may want to convert the annualized implied volatility to daily or weekly.
Converting Volatility to Daily
Converting volatility (standard deviation) from annual to daily is quite simple. The only thing to keep in mind is that volatility is proportional to the square root of time, and not to time itself. This is because volatility, and more generally standard deviation, is the square root of variance and because variance is proportional to time. Therefore volatility is proportional to square root of time (more detailed explanation here).
Knowing this, you can easily convert annual volatility to daily volatility by dividing it by the square root of the number of trading days per year. Assuming 252 trading days per year, which has been the average for US stock and option markets in the last years, you can convert annual implied volatility to daily volatility by dividing it by the square root of 252, or approximately 15.87. In Excel, you can use the function SQRT to calculate square root.
Example
For example, is you find that implied volatility of a particular option is 25% (either by observing it in a trading platform or calculating it from the option's price), the daily implied volatility is:
25% / 15.87 = 1.57%
Rule of 16
Traders sometimes round the square root of the number of trading days per year to 16 (this is sometimes referred to as the volatility rule of 16). It allows quicker and easier calculation and is still accurate enough for most purposes (16 is actually the square root of 256).
In our example, dividing by 16 rather than 15.87 would make the resulting daily volatility equal to 1.56%.
Interpreting Daily Volatility as Expected Moves
The daily implied volatility which we have just calculated can be interpreted as the expected standard deviation of daily price changes (over the remaining life of the option) being 1.57%.
This does not mean that every day the stock will move by 1.57%. Even if the actual realized volatility turns out matching the market's expectations (which is rarely the case), some moves will be smaller, some bigger, some positive, and some negative.
Only on average, the general size of the moves will be so big that their standard deviation will be 1.57%.
Assuming normal distribution of returns and mean expected return of zero, we can expect the actual daily price moves to fall:
- within one standard deviation from zero (i.e. greater than -1.57% and smaller than +1.57%) on 68% of days (about 2 out of every 3 days) and
- within two standard deviations (between -3.15% and +3.15%) on approximately 95% of days (about once a month).
Periods Other Than Daily
What if you want to know the probabilities for some period other than daily? For example, your options expire 3 weeks from now and you want to know how likely different price moves are from now to expiration.
Knowing that volatility is proportional to the square root of time, it is very simple:
Just as we converted annual volatility to volatility per one trading day by dividing it by the square root of number of trading days per year, now we can convert annual volatility to 3-week volatility by dividing it by the square root of 52 (as there are 52 weeks in a year) and multiplying by the square root of 3 (because we want 3-week volatility). In other words, 3-week volatility is calculated as:
Annual volatility * sqrt(3/52)
In our example, when annual volatility is 25%, 3-week volatility is
25% sqrt(3/52) = 25% 0.24 = 6%
This means there is approximately
- 68% probability the price 3 weeks from now will be between -6% and +6% (one standard deviation) from the current price and
- 95% probability it will be between -12% and +12% (two standard deviations) from the current price.