This is the final part of the Option Payoff Excel Tutorial. We have learned how to calculate profit or loss for a single option and for strategies with multiple legs. We have learned how to draw option payoff diagrams in Excel, and calculated maximum profit, maximum loss, risk-reward ratio and break-even points.
Our spreadsheet has become a powerful tool to analyze potential option trades. However, there are still things we could possibly improve and in this last section we will discuss some of them.
Unlike the previous parts where you could always find very detailed step-by-step instructions to create all the necessary formulas, in this part I will just present the rough ideas and I will leave the implementation to you. After all, if you have followed the tutorial all the way from the beginning up to this point, you should be able to make these adjustments and extensions on your own.
So let's get to the individual points.
Design and Practical Use
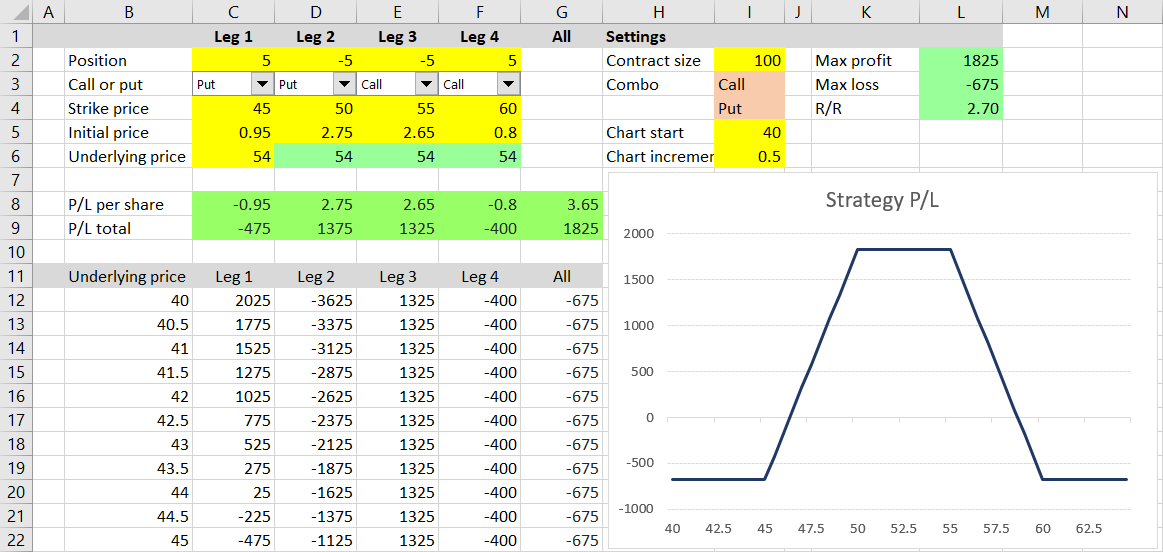
The main focus of the tutorial has been on the hard and important things – mainly the underlying logic and calculations. We haven't paid much attention to visual design, such as location of particular parts, colors or borders. At the moment, while our calculations are ready and correct, the spreadsheet may look a bit disorganized.
Just a few problems that come to mind:
- In the previous section we have calculated break-even points, but the results of these calculations are deep down in rows 76-80. You have to scroll down every time you want to see them. We should display the B/E's at the top next to the other results.
- Conversely, the chart's background calculations are not really interesting on their own and you would rarely want to see the values in real world use, but they occupy a prominent area starting with row 11. We should shift them down and make space for more interesting things – for example, we can move the chart itself to the left and make it bigger.
- Similarly, the combo box text inputs in cells I3-I4 don't need to be there in the middle in direct view. Let's move them out of sight.
These are just some of the things which we can easily fix and make the spreadsheet cleaner and easier to use. I won't be providing detailed instructions, because, firstly, layout and visual design are often matters of personal preference, and, secondly, there is nothing too complicated.
Just one hint: When moving cells to a different location, it is better to do so by inserting and deleting cells, rows, or columns, than copy and paste the cells' content – you won't break the references in formulas.
The screenshot below is just an example how the spreadsheet can look with a bit of cleanup and formatting.
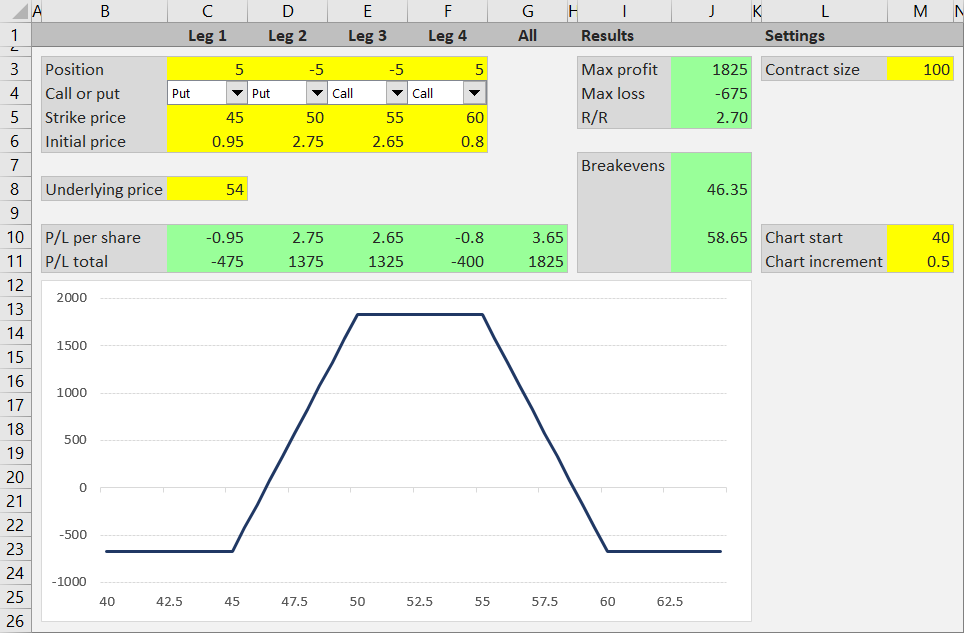
Some things I have done:
- I have moved the combo box text data from cells H3-I4 to cells P3-Q4.
- I have hidden underlying price for legs 2-4 (cells D8-F8, previously D6-F6) by setting background and font to have the same color. This can be a dangerous tactic though, because when a cell appears to have no content but it has, a user can accidentally delete it and calculations may break down. An alternative solution would be to change the formulas which use these cells and link them all to cell C8.
- In the new break-evens area in cells I7-J11, I display empty cells instead of zeros. The formula in J7 is
=IF(J92=0,"",J92)where J92 is the first cell with B/E results (previously I76).
Change your own spreadsheet to your liking and you will find it much easier to use.
Covered Calls and Positions in the Underlying
Our spreadsheet can work with any combination of up to four options and it can be used for modeling many of the common option strategies. However, it can't be used for covered calls, protective puts, collars, and generally positions which besides call or put options also involve a long or short position in the underlying security. These are some of the most popular option strategies.
There are two main ways to fix this.
The quick fix is to enter a position in the underlying as a call option with strike price set to zero, because mathematically the profit/loss profile is exactly the same. For example, the screenshot below shows a covered call position.
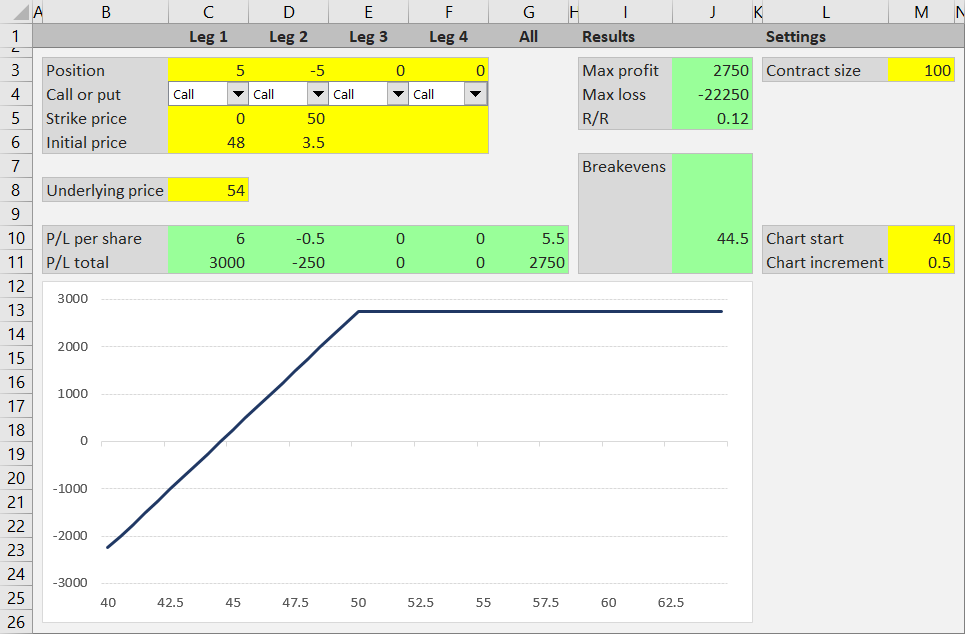
The position includes long 500 shares of the underlying stock, bought for $48 (leg 1) and short 5 contracts of $50 strike calls, sold for $3.50. All the results are correct, including the break-even point at $44.50, but one problem with this solution is that you must enter the long stock position size in option contract equivalents (5 for 500 shares in our example), because the calculator treats it as a call option.
A better solution would be to set up a third security type in addition to "Call" and "Put" – we could name it "Stock" or "Underlying". It would require more changes to our spreadsheet – particularly to the combo boxes and all the formulas which calculate individual leg P/L in columns C-F (you would need to include some more IF functions there).
Automating the Chart's X-axis
When using the spreadsheet for different underlyings and different option strategies, it won't take long until you find it quite annoying that you have to manually change the Chart start and Chart increment setting every time. Although our existing solution is much better than having to change the chart's X-axis the default Excel way (using Format Axis), it is still far from ideal. It would be nice if the scale changed automatically every time we change some of the input parameters.
Unfortunately, although definitely possible, this is much harder than it would seem, especially when you also want the tick marks and labels on the X-axis to be nice round numbers (so the axis goes something like 45, 50, 55 etc. and not 45.31, 49.18, 53.05 etc.).
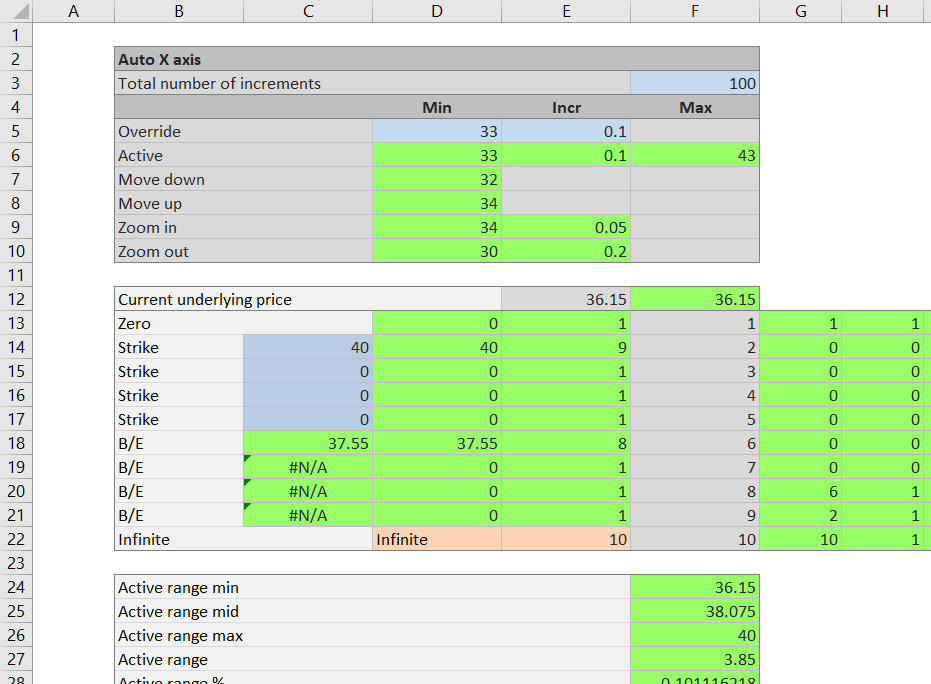
It would require quite a lot of new calculations and/or macros. An example of how it can be done is available in the Option Strategy Payoff Calculator, where I have set up an entire sheet for these calculations, named "Auto X" (the screenshot below shows just about a half of all the calculations needed).
What Happens before Expiration?
Our spreadsheet can do a lot of interesting things analyzing option strategies as they would be at expiration. However, in practice many positions are closed long before the options expire. Often a trader sets up a position without the intention of holding until expiration, but with expectations of a particular move in underlying price or implied volatility, and gets out as soon as these expectations materialize (or are proven wrong).
In such cases, there are other things to watch and other statistics to calculate that are much more important than payoff at expiration, such as the Greeks (delta, gamma, theta, vega, and more). You may also want to calculate expected profit or loss and break-even points at some point in the future, but before expiration, when the options still have time value.

These calculations are much more complicated than the ones we have seen in this tutorial. One reason is that we can't rely on the assumption that the P/L function is linear. We have to work with things like convexity, implied volatility, probability distributions and option pricing models. These are beyond the scope of this tutorial, but you can find other tutorials on the Macroption website – a good place to start is the Black-Scholes option pricing model.
The End
That's it for the Option Payoff Excel Tutorial – I hope you have found it useful.
If you have any feedback, questions or suggestions, please contact me.
You may also want to check the Option Strategy Payoff Calculator, where you can see the ideas and calculations in action, and find some more explanation in the calculator's user guide.
