This page explains the payoff profile of collar option strategy – different scenarios at expiration, maximum profit, maximum loss, break-even point and risk-reward ratio.
Collar Strategy Basic Characteristics
Collar is an option strategy that involves a long position in the underlying, a short call and a long put. The common approach is for both the call and the put to be out of the money – the call strike is typically higher and the put strike lower than underlying price at time of entering a collar position.
If you are familiar with covered call and protective put option strategies, you can consider collar as a combination of the two ideas. Like in covered call, the short call option provides income as you receive premium when selling the call, but it also limits the potential upside that you would otherwise have when holding a stock or some other underlying. Like in protective put, the long put option protects you from losses in case of bigger drop in the underlying price. The income received from selling the call helps finance the cost of buying the put.
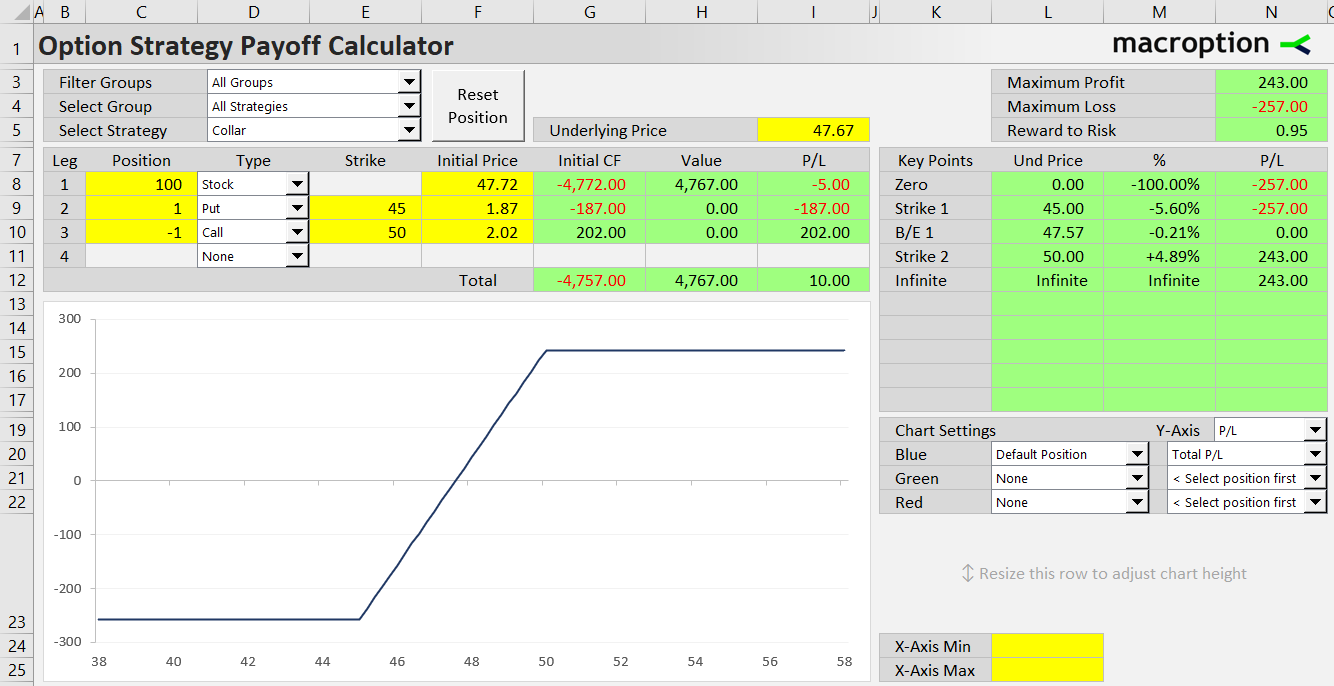
Collar is a bullish strategy, as you are still exposed to underlying price changes between the two strikes. It has limited profit (above the call strike) and limited risk (below the put strike). You can see the payoff diagram below:
We will explain the profit and loss profile on an example.
Collar Example
Let's say you are holding 100 shares of a stock, which you have bought for $47.72 per share.
In the short run you are concerned about a possible fall in price, but otherwise consider the stock a good long-term investment. You decide to buy put options to protect your position.
You buy one contract of $45 strike puts for $1.87 per share. US equity options are typically traded in contracts representing 100 shares of the underlying, so one contract exactly matches the size of your stock position. The put protects your position from any decline in the stock's price below $45.
While you like the stock from the long-term perspective, you don't expect its price to go up too far too quickly. To provide some income and help finance the put, you decide to sell a $50 strike call (with the same expiration date as the put) for $2.02 per share. You receive $202.
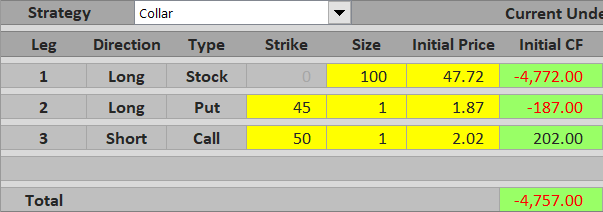
Total initial cost of the position is therefore:
- $4,772 paid for the stock
- $187 paid for the put
- minus $202 received for the call
... which is $4,757 in total, or $47.57 per share.
If you hold the position until the options expire, your profit or loss under different scenarios is as follows.
Scenario 1 (Maximum Loss)
If the worst thing happens and the stock drops, you lose a bit, but your losses are limited by the put option you have bought. Once the stock price gets below $45, the put option gets in the money and any further decrease in the stock price will be exactly compensated with an increase in the put's value (this is only true if the position sizes for the put and underlying stock match – in our example they are both 100 shares).
For example, if the stock price is at $41 by the time the options expire, your 100 shares are worth $4,100 – a significant loss. However, you will exercise the put option and gain $45 – $41 = $4 per share, or $400 for one contract. The call option is way out of the money and expires worthless.

In sum, your total position is worth $4,100 + $400 = $4,500 = $45 per share (which is exactly equal to the put strike). Because the initial cost of the entire position was $47.57 per share, your loss equals $2.57 per share, or $257.
Maximum possible loss from a collar position equals the difference between initial cost and put strike. It applies when underlying price is exactly at or below the put strike.
Scenario 2 (Maximum Profit)
If the stock jumps a bit more than you have expected, let's say to $52.50, the 100 shares you are holding make nice gains and are now worth $5,250.
However, once stock price gets above $50, the call option you have sold gets in the money and erase any further gains in the shares (assuming the long stock and the short call position sizes match – in our example they are both 100 shares). With the stock price at $52.50 at expiration, you will be assigned the short call and lose $52.50 – $50 = $2.50 per share = $250. The put option is out of the money and worth zero.
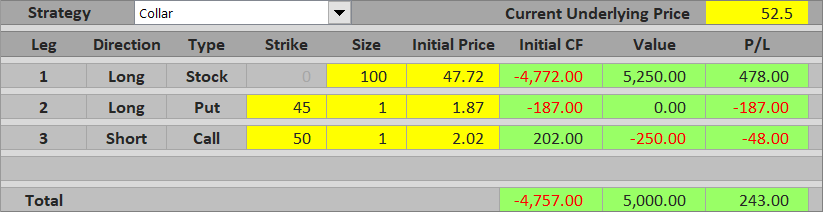
In total, your position is worth $5,250 from the long stock minus $250 from the short call, which is $5,000 = $50 per share = exactly the call strike. With total initial cost of $4,757 your total profit is $243, or $2.43 per share.
Maximum possible profit from a collar position equals the difference between the call strike and initial cost. It applies when underlying price is at or above the call strike.
Scenario 3 (Between the Strikes)
If the stock price ends up somewhere between the strikes, both the call and the put will be out of the money and worthless. Your position's value will be equal to the value of the shares you are holding. If the stock price is above your total initial cost per share (which also includes the cash flow from buying and selling the options), you make a profit.
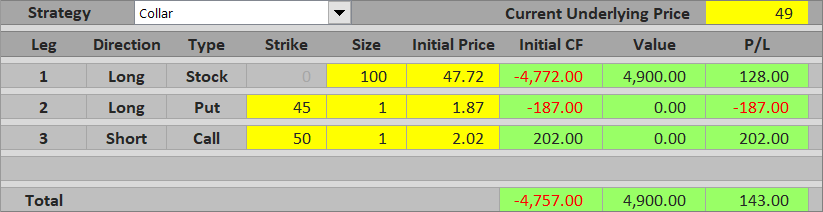
If it is below that, you make a loss.

Between the put and call strike, total profit or loss from a collar equals the difference between underlying price and initial cost. It approaches maximum profit near the call strike; it approaches maximum loss near the put strike.
Collar Break-Even Point
The break-even point for a collar position is very easy to calculate. It equals to initial cost of the entire position = what you have paid for the stock and for the puts minus what you have received for the calls. A common mistake is to only take the underlying position's cost into account – the options must also be included.
B/E = total initial cost
B/E = underlying cost + put cost – call premium received
Collar Risk-Reward Ratio
Because both profits and losses are limited, we can calculate risk-reward ratio. In our example, maximum possible loss is $257 and maximum possible profit is $243. The risk-reward ratio is therefore very close to 1:1, or 1:0.95 to be precise.
The general formulas are as follows:
Maximum loss (risk) = total initial cost – put strike
Maximum profit (reward) = call strike – total initial cost
Again, total initial cost includes cash flow from all the legs – the underlying, the puts and the calls. Also note that all these calculations assume the position sizes of all legs exactly match, as they do in our example (always 100 shares). If there are little differences (e.g. 320 shares of the underlying and 3 contracts of the options), the payoff profile becomes a bit skewed and the exact calculations become more complicated.
Similar Option Strategies
We have already mentioned that collar combines the ideas of covered call (long underlying + short call = limited upside) and protective put (long underlying + long call = limited downside).
Collar has similar payoff profile to bullish vertical spreads, namely bull call spread (long lower strike call + short higher strike call) and bull put spread (long lower strike put + short higher strike put).
Other vertical spreads provide inverse payoff – namely bear put spread (long higher strike put + short lower strike put) and bear call spread (long higher strike call + short lower strike call).