This is part 3 of the Option Payoff Excel Tutorial. In the first part we have created payoff formulas for calls and puts. In the second part we have merged the two into one calculation, where you can select call or put in a combo box and calculate profit or loss for different strikes and underlying price.
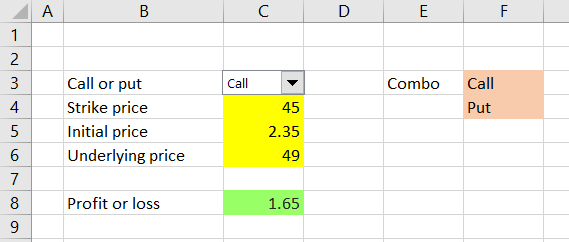
At the moment, the result in the green cell C8 shows profit or loss per share. This is a useful piece of information, but in practice traders often want to see profit or loss as total dollar amount for their particular position, which may involve multiple option contracts and may be long or short.
In this part of the tutorial, we will expand the spreadsheet to also consider:
- Contract size (how many shares one option contract represents)
- Position size (number of contracts we are holding)
- Direction (long or short)
Adding Contract Size
Options are typically traded in standardized contracts, where one contract represents a number of shares or units of the underlying. For example, US traded stock and ETF options typically trade in contracts of 100 shares, so a calculated P/L of $1.65 per share means $165 for one option contract.
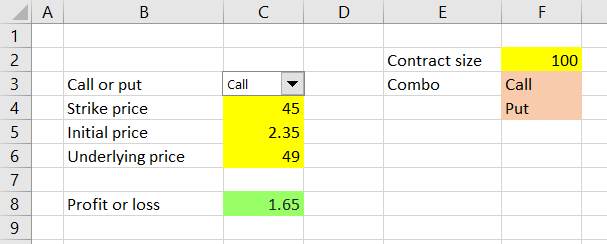
Options on other assets or in other parts of the world can have different contract sizes, like 10 or 1,000, but also non-round numbers, such as 25, 40 or 75. Therefore, it is best to enter contract size as another input, another yellow cell which we can easily change, rather than hard code it into the P/L formula.
That said, in practice a user probably won't be changing the contract size input as often as the other inputs, so we will place it slightly out of the way, in order to keep our main calculation area simple and easy to use (just a design choice). Let's put it in cell F2 and enter 100 shares for now.
We will set up a second result cell in C9, right below the per share result, this time showing profit or loss as total dollar value for one contract. The formula is very simple, because we can use the per share result which we already have – just multiply the per share result by the new contract size input:
=C8*F2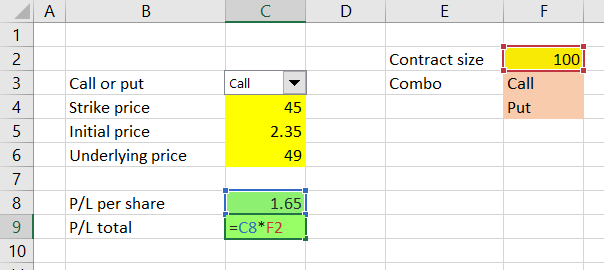
Now we have the calculator showing profit or loss per share (cell C8) and for one option contract (cell C9).
Adding Position Size
Next we will add another input cell for number of contracts. Let's put it at the very top above the call/put combo box, in cell C2.
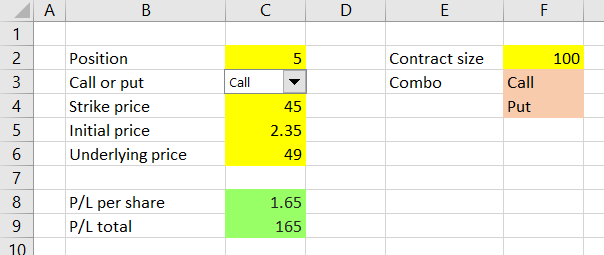
We will adjust the P/L total output cell to reflect position size, again simply by multiplying the existing formula (P/L for one contract) by the number of contracts in cell C2:
=C8*F2*C2
Now cell C9 shows profit or loss for a given number of contracts (cell C2) and given contract size (cell F2).
Adding Direction
The last feature to add is to make our calculator also work with short positions. In fact, when you are short an option position, the payoff is exactly inverse to the corresponding long position – the difference in calculation is just a minus sign (see examples for short call and short put).
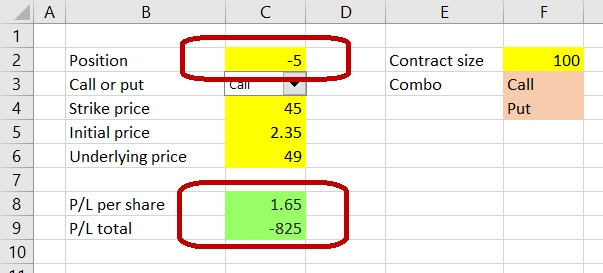
Therefore, to calculate P/L for short positions, we actually don't need to add any further inputs. If you enter a short position as negative number of contracts in cell C2, the result in cell C9 will show the correct P/L.
For example, when we are short 5 contracts of $45 strike calls which we have sold for $2.35 per share, with underlying price at $49 we lose $825, because our short calls are in the money.
There is one little detail which still needs fixing though. The P/L per share in cell C8 should really show the same sign as the total P/L in cell C9 (positive for profit, negative for loss).
It is a very easy fix – just add a minus sign to our formula in cell C8 when cell C2 is a negative number (short position). We will use the SIGN Excel function, which takes one argument and returns +1 when the argument is a positive number (in our case a long position in cell C2), -1 for a negative number (short position) and zero for zero.
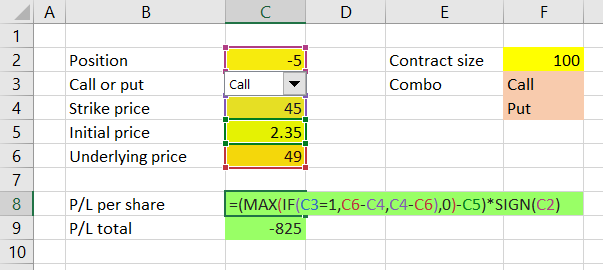
The adjusted formula in cell C8 is:
=(MAX(IF(C3=1,C6-C4,C4-C6),0)-C5)*SIGN(C2)Don't forget the brackets around the entire previous content of the formula (ending with -C5), because all of it must be multiplied by the new sign.
Now our P/L per share shows the correct sign (plus for profit, minus for loss) for long as well as short positions.
But unfortunately...
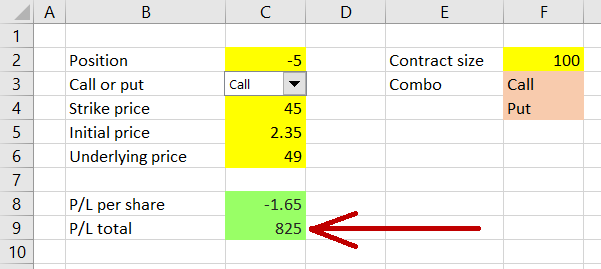
... it seems that by changing cell C8 we have created a problem (incorrect sign) in cell C9, which uses C8 as input. This is because cell C9 now actually gets the sign of the position twice – once from C8 (which now contains sign of C2) and again from C2 directly:
=C8*F2*C2As you surely remember from math classes, minus times minus is a plus.
To fix this, we must remove one of the signs from the formula in C9. The idea is to always make the sign of C9 the same as the sign of C8 (which is now correct). We will achieve this using the ABS Excel function, which returns absolute value of its argument. The formula in C9 becomes:
=C8*F2*ABS(C2)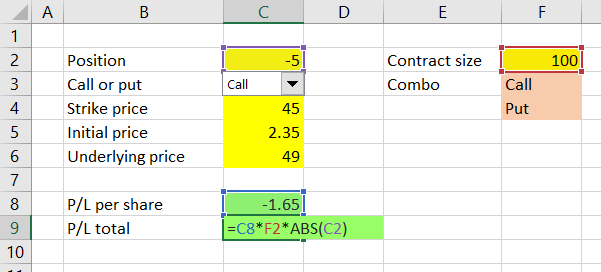
Now cell C9 takes the P/L per share from cell C8 and multiplies it by number of shares per contract (F2) and number of contracts, but without position direction – ABS(C2). It always has the same sign as cell C8 – positive for profit, negative for loss.
Note: You could achieve the same result by calculating cell C9 directly from the inputs rather than from cell C8. Just copy paste the exact formula from C8 to C9 and replace the *SIGN(C2) at the end with *F2*C2:
=(MAX(IF(C3=1,C6-C4,C4-C6),0)-C5)*F2*C2In this case, both C8 and C9 calculate P/L per share for a long position and then C8 multiplies it by position direction only (+1 or -1), while C9 multiplies it by direction, number of contracts and number of shares per contract.
From the perspective of performance and design, the first solution =C8*F2*ABS(C2) is better, because the formula is simpler and will be faster to calculate than the long one with MAX and IF. It is not really important in this particular case, because our spreadsheet is very small and simple and you won't notice any difference in speed. Nevertheless, it is a good habit to develop to always use the simplest and fastest formulas available – it can make a noticeable difference when working with more complex formulas and bigger spreadsheets. One of the objectives of this tutorial is to show you there are often multiple ways to implement the same calculation in Excel and in many cases one is better than others, although all return the same result.
Next Steps
We now have a spreadsheet that can calculate profit or loss for any position (long or short, any number of contracts) in a single call or put option. In the next part we will expand it to also work with positions involving different options, enabling us to calculate profit or loss for strategies like straddles, spreads, condors or butterflies.
Go to next part: Calculating Option Strategy Payoff in Excel