This is part 6 of the Option Payoff Excel Tutorial. In the previous parts we have created a spreadsheet that calculates profit or loss for option strategies and shows the payoff diagram.
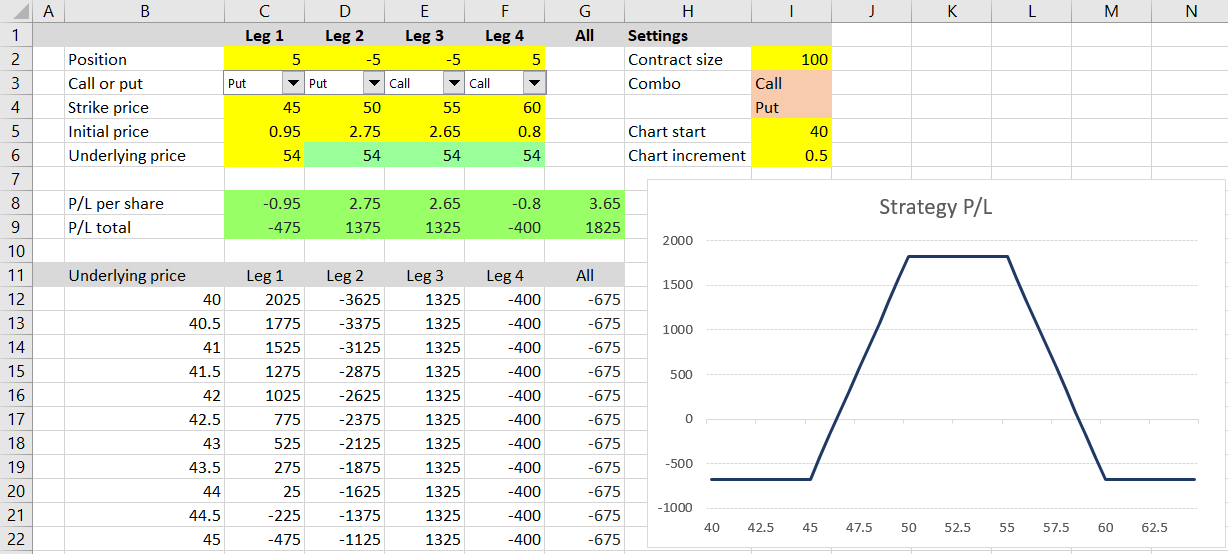
Now we are going to calculate maximum possible loss (risk) and maximum possible profit. You can often get a good idea of these just from looking at the payoff diagram, but we want to calculate the exact values.
One quick solution would be to simply use the MIN and MAX Excel functions to find the maximum and minimum of the P/L values in cells G12-G61. However, this solution assumes the chart's X-axis includes the underlying prices where maximum loss and maximum profit occur, which may not always be the case, for example when a strategy has infinite maximum profit or loss, or when we want to zoom in and make the chart focus only on a smaller price area.
In short, we want to make our maximum loss and maximum profit calculations independent of the chart's current X-axis range and consider all possible underlying price points.
Things to Know about the Payoff Function
There are some important properties of the payoff function which will be useful for our calculations.
Firstly, because we are working with profit or loss at expiration, the function is always a straight line.
It may be constant, upward sloping or downward sloping, but it is always linear – a straight line, no curves (we get curves only when calculating P/L before expiration when the options still have time value, which is not the case in this tutorial).
Secondly, the direction or slope of the P/L function can only change at the strikes.
This is helpful for the calculation of maximum profit and maximum loss, because we don't need to calculate P/L for all possible underlying price points. We only need to calculate P/L at a small number of "important" price points – those where the P/L function can theoretically reach extreme values or change direction.
The Important Underlying Price Points
The only underlying price points where P/L at expiration can reach maximum profit or maximum loss are the following:
- The option strikes
- Zero
- Infinite
We only need to calculate P/L at each of these points. The highest of the values is maximum possible profit; the lowest is maximum loss (or risk) of the position.
Calculating P/L at Strikes and at Zero
We will continue to expand our example spreadsheet which we have created in the previous parts of the tutorial. We will make the new calculations at the bottom, below the calculations for the chart which we added in the previous part.
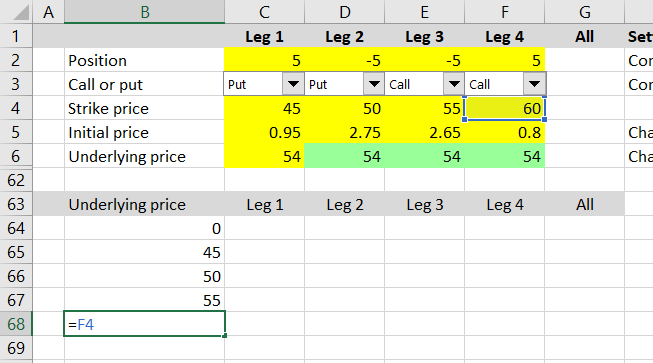
We can copy the labels from row 11 to row 63. In the following rows we will calculate P/L for zero and for each of the four possible leg strikes. Cells B64-B68 will be as follows:
- B64 = 0
- B65 = C4 (first leg strike)
- B66 = D4 (second leg strike)
- B67 = E4 (third leg strike)
- B68 = F4 (fourth leg strike)
In some cases (for example straddles) some of the legs will have the same strike. This is not a problem, as including the same point multiple times won't affect the resulting maximum and minimum.
For positions with fewer than four legs (for example straddles again, or call or put spreads), we may have some values in the strike input cells which are not really strikes in the current position, because that particular leg is inactive (zero position size). This won't affect the results either, because these points can't theoretically be the maximum or minimum. The key is not to miss any of the important points (the points which can possibly be maximums or minimums), but if we also include points which are not really "important", that is not a problem.
In columns C-G we can copy the formulas from row 61 (the last point on the chart's X-axis), because the calculations are the same.
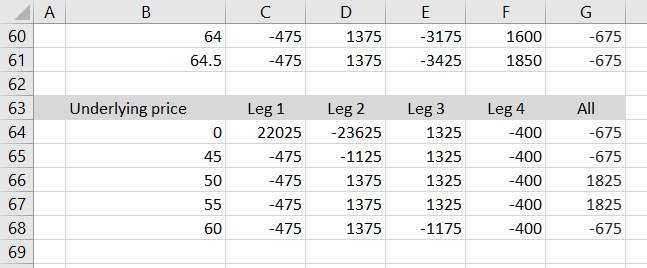
We have now calculated P/L for underlying price at zero and at each of the strikes.
P/L at Infinite Underlying Price
While the underlying price can't (for most underlyings) fall below zero, there is no limit to the upside – a stock price or index value can theoretically become infinitely high. How can we calculate P/L at infinitely high underlying price?
Fortunately, we know that the P/L function can only change direction at the strikes. This means that its slope will remain the same all the way from the highest strike to infinite. As a result, profit or loss at infinitely high underlying price can only reach one of three values:
- Exactly the same as highest strike P/L when the P/L function is constant above the highest strike
- Positive infinite (unlimited profit) when the P/L function is increasing above the highest strike
- Negative infinite (unlimited loss) when the P/L function is decreasing above the highest strike
Therefore, the only thing we need to find out is the P/L function's direction just above the highest strike. We can do this very easily by calculating P/L for one (any) underlying price that is slightly higher than the highest strike, for example highest strike + 1.
In our example, the strikes for legs 1/2/3/4 happen to be ordered from lowest to highest (45/50/55/60 iron condor), but this might not be the case with other positions. Therefore, rather than simply assume the fourth strike (row 68) is the highest strike, we should check all the four strikes and find the highest value. We will calculate the highest strike in cell B69 as MAX of all the four strikes:
=MAX(B65:B68)Cell B70 will be some underlying price that is higher than the highest strike, for example:
=B69+1I have chosen +1, but it can by any positive number – the only requirements are that cell B70 is greater than cell B69 and cell B69 is the highest strike.
In columns C-G we can copy the formulas from row 68 to rows 69 and 70 to calculate P/L.
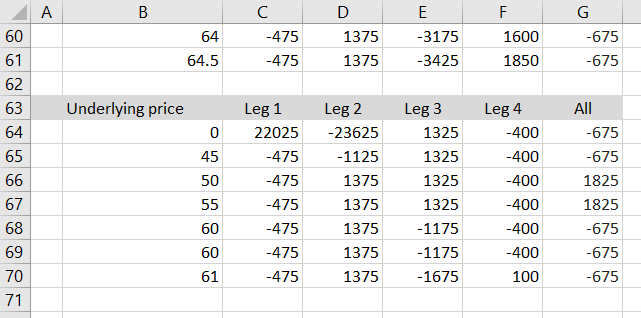
Now we can easily see the direction of the P/L function above the highest strike by comparing cells G69 and G70:
- If G70=G69 then P/L is constant above highest strike and P/L at infinite underlying price equals P/L at highest strike
- If G70>G69 then P/L is increasing above the highest strike and P/L at infinite underlying price equals positive infinite (which is also maximum possible profit of the entire position)
- If G70<G69 then P/L is decreasing above the highest strike and P/L at infinite underlying price equals negative infinite (which is also maximum possible loss of the entire position)
Now we have all the necessary information for the actual maximum profit and maximum loss formulas. Let's put them to the top of the spreadsheet to cells L2 and L3.
Maximum Profit Formula
There are two possible scenarios:
- If G70>G69 then maximum profit is infinite.
- If not, maximum profit is the highest of P/L at the strikes and zero.
Let's calculate maximum profit in cell L2 using the IF and MAX Excel functions, which should be already familiar from the previous parts of the tutorial:
=IF($G$70>$G$69,"Infinite",MAX($G$64:$G$68))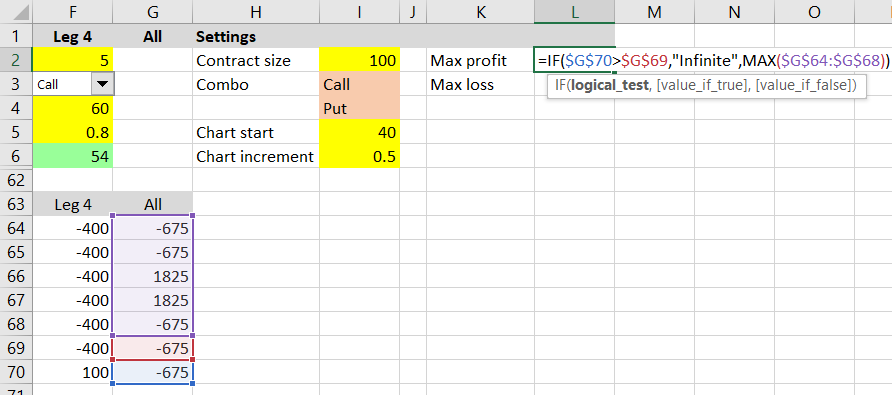
Maximum Loss Formula
For maximum loss the logic is similar to above. There are two possible scenarios:
- If G70<G69 then maximum loss is infinite.
- If not, maximum loss is the lowest of P/L at the strikes and zero.
The maximum loss formula in cell L3 is:
=IF($G$70<$G$69,"Infinite",MIN($G$64:$G$68))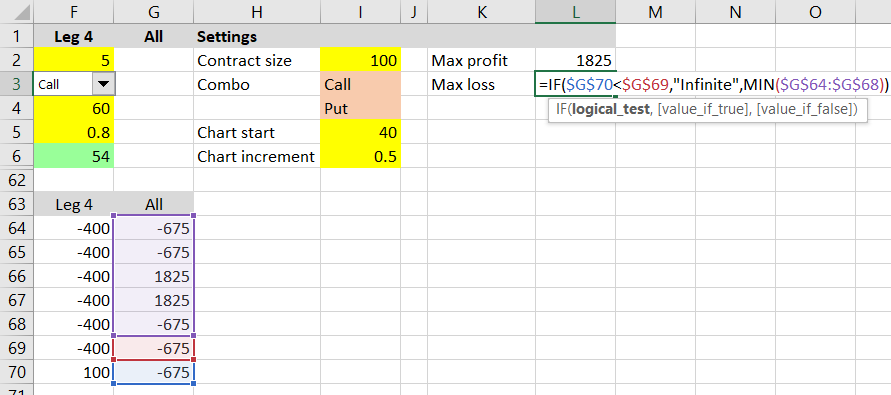
A loss will have negative sign, so a result of -675 means maximum possible loss from the position is $675 dollars.
Next Steps
We have now calculated maximum possible profit and maximum possible loss for a given option strategy. It was perhaps a bit longer and more complicated than you would have expected, as we had to make sure our calculations would correctly identify and handle the situations where maximum profit or loss could be infinite.
In the next section we will use these numbers to calculate the risk-reward ratio.
Go to next part: Calculating Option Strategy Risk-Reward Ratio