This page explains put option profit/loss at expiration, payoff diagram, and break-even calculation. If you have seen the page explaining call option payoff, you will find the overall logic is very similar with puts; there are just a few differences which we will point out.
See also short put payoff (inverse position).
On this page:
- Long Put Option Position is Bearish
- Put Option Payoff Diagram
- Put Option Scenarios and Profit or Loss
- 1. Underlying price is lower than strike price
- 2. Underlying price is equal to or higher than strike price
- Put Option Payoff Formula
- Put Option Payoff Calculation in Excel
- Put Option Break-Even Point Calculation
- Long Put Option Payoff Summary
Long Put Option Position is Bearish
While a call option gives you the right to buy the underlying security, a put option represents the right (but not obligation) to sell the underlying at the given strike price. When holding a put option, you want the underlying price go down, because the lower it gets relative to the strike price, the more valuable your put option becomes. A long put option position is therefore a bearish trade – makes money when underlying price goes down and loses when it goes up.
Note: If you are a bit lost in the long/short/bullish/bearish terminology, see Call, Put, Long, Short, Bull, Bear... Confused?
Put Option Payoff Diagram
You can see the payoff graph below. It shows a long put option position's profit or loss at expiration (Y-axis) as a function of underlying price (X-axis).
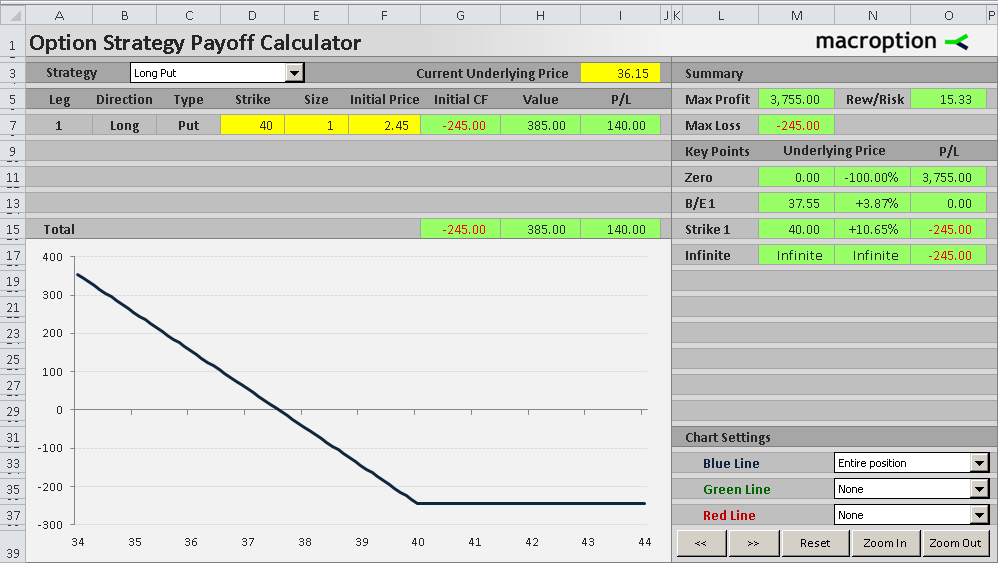
Besides underlying price, the payoff depends on the option's strike price (40 in this particular example) and the initial price at which you have bought the option (2.45 per share in this example). Of course, it also depends on your position size (1 contract representing 100 shares in this example).
Put Option Scenarios and Profit or Loss
1. Underlying price is lower than strike price
As you can see in the diagram, a long put option's payoff is in the positive territory on the left side of the chart and the total profit increases as the underlying price goes down. The relationships is linear and the slope depends on position size. In this case, with 1 contract representing 100 shares, the profit increases by $100 for every $1 decrease in underlying price.
For example, if underlying price is 36.15, you can exercise the put option and sell the underlying security at the strike price (40.00). You can immediately buy it back on the market for 36.15, realizing a profit of 40 – 36.15 = 3.85 per share, or $385 per option contract. With initial cost of $245, total result of the trade is 385 – 245 = $140 profit.
2. Underlying price is equal to or higher than strike price
The payoff function changes where underlying price equals the option's strike price (40 in this example). Above the strike, the put option has zero value, because there is no point exercising the right to sell the underlying at strike price when you can sell it for a higher price without the option. Therefore total P/L is actually a loss equal to the initial cost of the option ($245 in this example).
Put Option Payoff Formula
As you can see from the examples above, a long put option trade's total profit or loss depends on two things:
- What you can get when exercising the option
- What you have paid for the option in the beginning
The first component is equal to the difference between strike price and underlying price. The lower underlying price gets relative to strike price, the higher your cash gain at expiration.
CF at expiration = strike price – underlying price
However, this only applies when underlying price is below strike price. When it gets above, the result would be negative (you would be losing money by exercising the option). Because a put option gives you the right but not obligation to sell, if underlying price is above strike price, you choose to not exercise the option and therefore cash flow at expiration is zero.
Taking all scenarios into consideration, a long put option cash flow at expiration is therefore the higher of:
- Strike price – underlying price
- Zero
CF at expiration = MAX ( strike price – underlying price , 0 )
The above is per share. To get the total dollar amount, you need to multiply it by number of contracts and contract multiplier (number of shares per contract).
Using the example with strike = 40 and underlying price = 36.15 we get:
CF at expiration = MAX ( 40 – 36.15 , 0 )
CF at expiration = MAX ( 3.85 , 0 )
CF at expiration = $3.85 per share
CF at expiration = $3.85 x 1 contract x 100 shares per contract = $385
Initial cost is of course the same under all scenarios. Therefore the formula for long put option payoff is:
P/L per share = MAX ( strike price – underlying price , 0 ) – initial option price
P/L = ( MAX ( strike price – underlying price , 0 ) – initial option price ) x number of contracts x contract multiplier
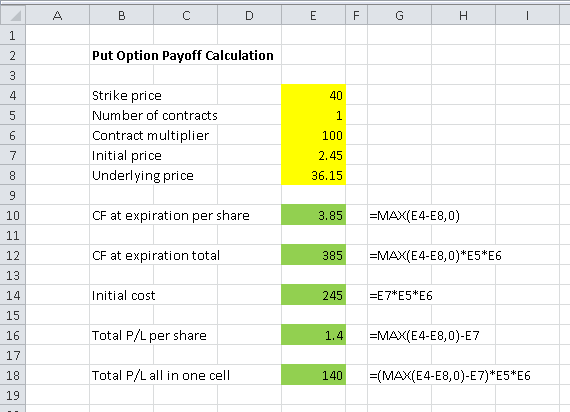
Put Option Payoff Calculation in Excel
It is very easy to calculate the payoff in Excel. The key part is the MAX function; the rest is basic arithmetics. You can see all the formulas in the screenshot below.
Put Option Break-Even Point Calculation
Besides the strike price, another important point on the payoff diagram is the break-even point, which is the underlying price where the position turns from losing to profitable (or vice-versa). On the chart it is the point where the profit/loss line crosses the zero line and you can see it's somewhere between 37 and 38 in our example.
Calculating the exact break-even price is very useful when evaluating potential option trades. The formula for put option break-even point is actually very simple:
B/E = strike price – initial option price
In our example:
B/E = 40 – 2.45 = 37.55
At this price, what you can gain by exercising the option (the difference between strike and underlying price) is exactly equal to the initial price you paid for the option and the overall P/L is exactly zero.
Long Put Option Payoff Summary
- A long put option position is bearish, with limited risk and limited (but usually very high) potential profit.
- Maximum possible loss is equal to initial cost of the option and applies for underlying price higher than or equal to the strike price.
- With underlying price below the strike, the payoff rises in proportion with underlying price.
- The position turns profitable at break-even underlying price equal to strike price minus initial option price.
- Maximum theoretical profit (which would apply if the underlying price dropped to zero) is (per share) equal to the break-even price.