VIX Futures Curve Explained
A futures curve is a curve made by connecting prices of futures contracts of the same underlying, but different expiration dates. It is displayed on a chart where the X-axis represents expiration dates of futures contracts and the Y-axis represents prices. The chart looks quite similar to yield curve, which is used for bonds or the money market and displays interest rates of different maturities.
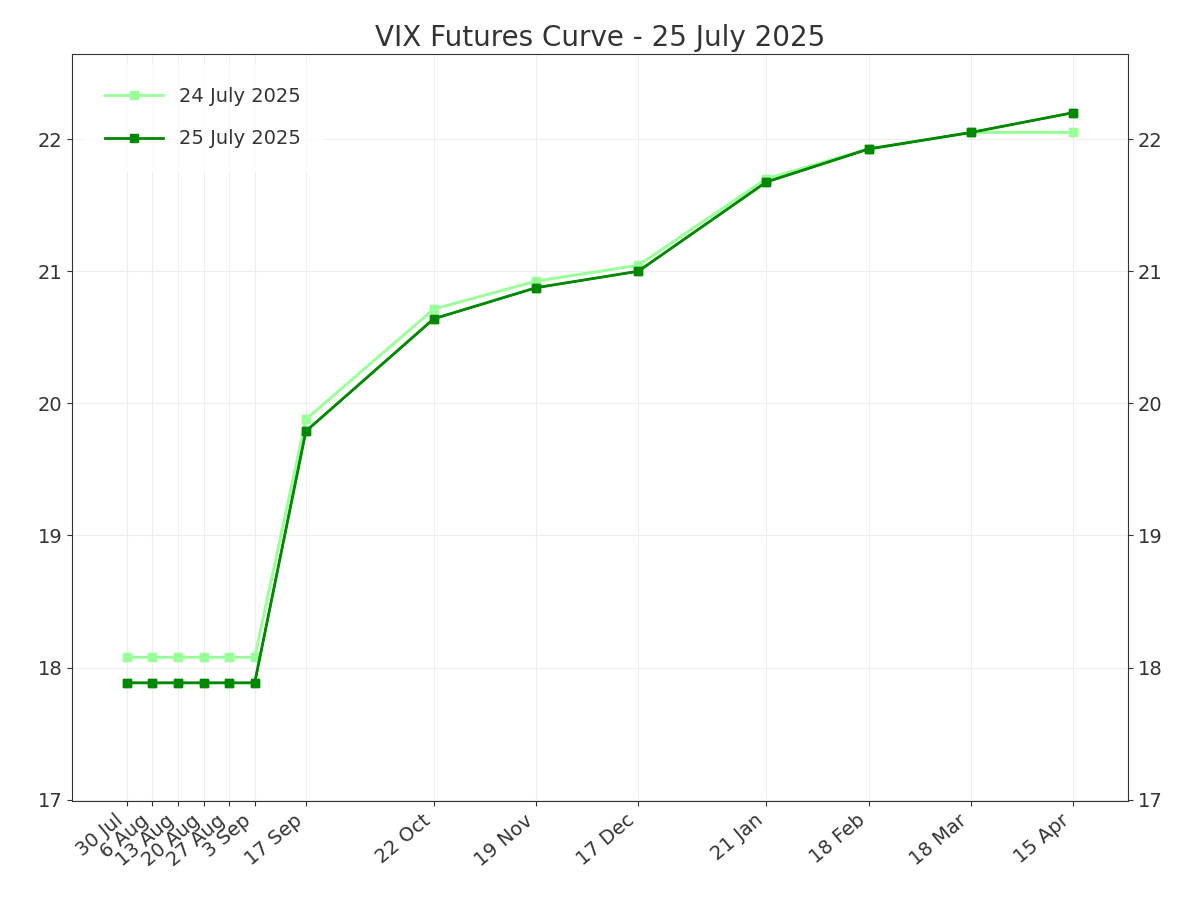
VIX futures curve is made of prices of individual VIX futures contracts. It may or may not include the spot VIX index value as the leftmost point (the chart above does not). It can include both weekly and monthly VIX expirations (the chart above includes both).
VIX Futures Contango vs. Backwardation
Contango
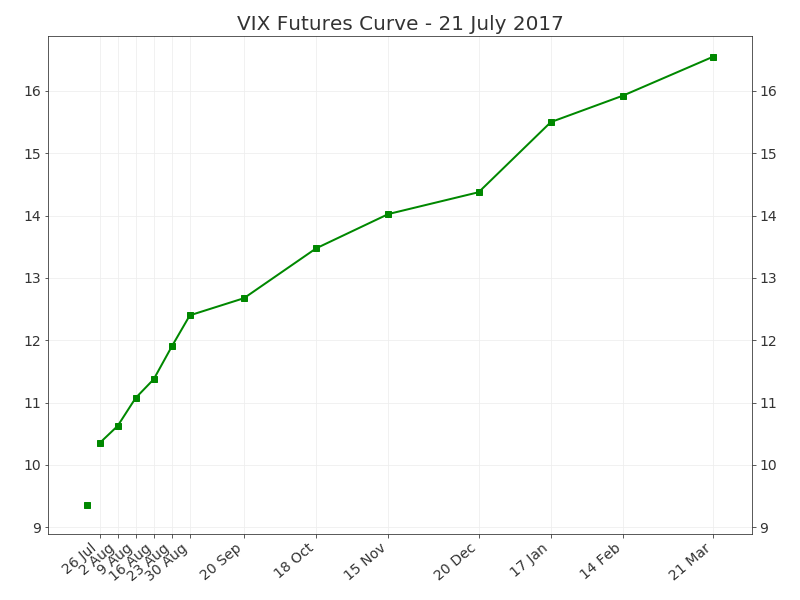
When a futures curve is upward sloping from left to right, it is called contango (we say that a market is in contango). In case of the VIX, it is when near term VIX futures are cheaper than longer term VIX futures, like the example below.

Contango can be interpreted in the way that the market expects the VIX index to increase from its current level going forward. This is very common in VIX futures – in the long run, contango occurs vast majority of time, which is due to the skewed and mean reverting nature of the VIX and volatility in general (long time at low levels, with occasional big but mostly short-lived spikes). VIX futures contango is typically sharpest when the spot VIX Index is very low.
Backwardation
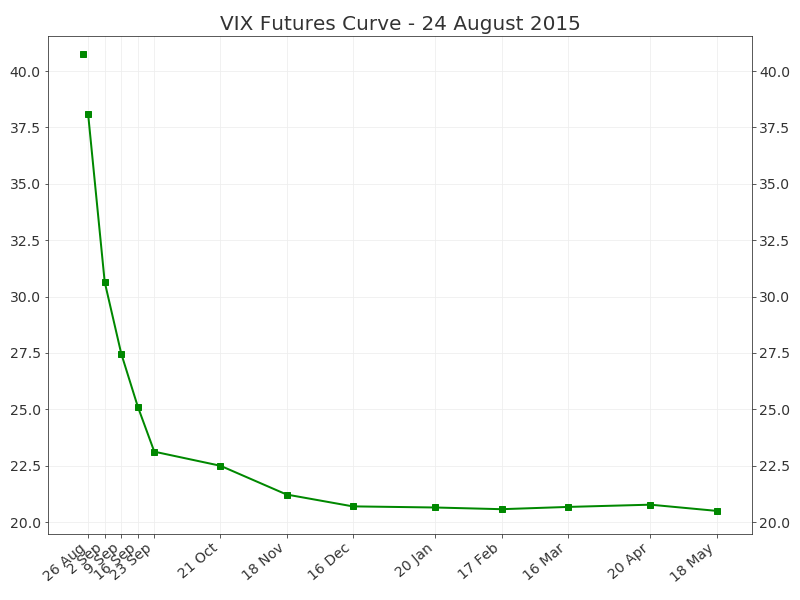
The opposite situation, when near term futures are more expensive and futures curve is downward sloping, is called backwardation.

Backwardation is less frequent than contango in VIX futures, but not uncommon. It typically occurs when the spot VIX index spikes and the market expects volatility to decrease again in the future.
VIX Futures Curve vs. VIX Term Structure
In general, a futures curve is often called "term structure", but it really displays the term structure of the futures market. In case of the VIX, this might be a bit confusing, because there is another concept of VIX term structure which is different from (and unrelated to) VIX futures.
This other VIX term structure is calculated from prices of S&P 500 index options, just like the VIX index itself. In fact, the VIX index (which measures implied volatility of S&P 500 options with target maturity of 30 days) is just one of the points on the VIX term structure. The other points measure implied volatility of S&P 500 options in the same way as the VIX index does, only with different maturities. You can find a detailed explanation of VIX term structure here.
VIX Futures Curve Data
The data needed for the VIX futures curve (daily prices of individual VIX futures contracts) is available for free on the official website of CBOE (Chicago Board Options Exchange – the exchange which owns and calculates the VIX and operates trading in its derivatives). Direct link:
https://www.cboe.com/us/futures/market_statistics/historical_data/
The data for VIX term structure (based on S&P500 option prices) is also available on CBOE website: https://markets.cboe.com/tradable_products/vix/term_structure/