Average True Range (ATR) takes only one parameter and that is the period length. Some users of the ATR Calculator have asked the question which period setting they should use – which is "the best".
The answer is of course there is no such thing as the best or most profitable ATR period, like there is no best technical indicator, trading strategy, time horizon, or market.
That said, on this page I will try to discuss things about the ATR period that some people may not be aware of, and things to consider when deciding which period is best for you or your trading style.
Shorter Period = Faster ATR
Like with virtually any other technical indicator, the shorter (smaller) the period, the greater the effect of the latest bar on the resulting ATR and the faster ATR will react to changes in market's volatility. ATR with period of 50 will be much slower and smoother than ATR with period of 5.
Period Does Not Always Mean Number of Days
A common misconception about ATR period is that it means number of days, or bars. For example, some sources claim that ATR with a period of e.g. 5 means the average of true range over the last 5 days, measuring average volatility in the last 5 days.
For the original Wilder's ATR this is not true (although he quite unfortunately uses wording like "14-day true range average" himself). It is inaccurate in the same way that exponential moving average with period of 5 is not the average closing price in the last 5 days. Only simple moving average is, and the above claim would only be true for ATR calculated as simple moving average of true range.
Different Calculation Methods and ATR Period
Average True Range can be calculated in a number of different ways. Besides the original formula presented by the already mentioned inventor of ATR J. Welles Wilder Jr. in New Concepts in Technical Trading Systems, at least two other calculation methods are commonly used in trading and charting software these days – the simple moving average method and the exponential moving average method. All these calculation methods and their exact formulas are discussed in more detail here.
Importantly, these three methods differ in the way they use the ATR period input to calculate ATR and therefore even with the same period setting they can lead to significantly different results.
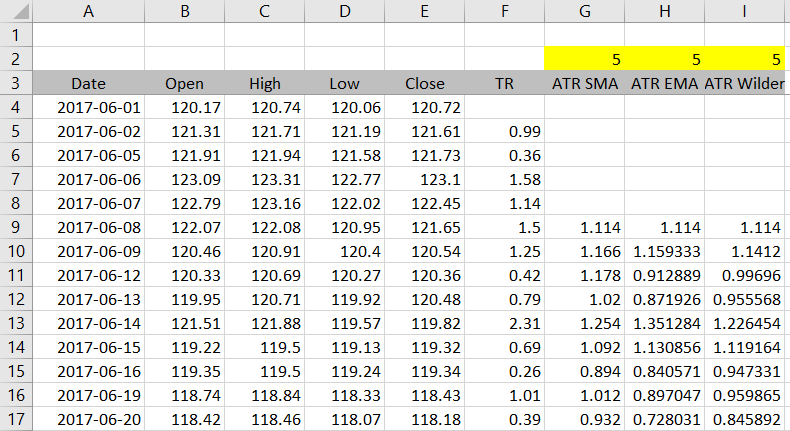
For example, the screenshot below is from the end of our ATR Excel tutorial and shows ATR with period 5 calculated under all three methods – SMA, EMA, and the original Wilder's smoothing method. You can see the results in columns G, H, I can differ by 10% or more:

This means that discussing ATR period makes no sense without also specifying the calculation method. Make sure you know which particular version of ATR your software is using.
Effect of ATR Period under SMA ATR
The effect of period length is easiest to understand under the SMA method, where ATR is just a simple moving average (= arithmetic average) of true range and therefore each day or bar within the rolling window has the same weight.
For example, with period set to 5, each of the last 5 days has exactly 20% effect on today's ATR. If you set a longer period, like 40, each of the last 40 days has only 2.5% effect and, as a result, ATR will be much slower to reflect volatility changes.
This is the only calculation method where period means number of days or bars.
Effect of ATR Period under EMA and Wilder's ATR
Under the two other calculation methods, the way the period input enters ATR formula is slightly different and so is its effect. The ATR formula under both methods is:
ATR = a · TR + ( 1 – a ) · ATR1
... where TR is current bar's true range, ATR1 is previous bar's ATR, and a is the smoothing factor – not the period, but a number calculated from the period and reaching values from 0 to 1.
In general, the greater a, the greater the share of current bar's true range in the resulting ATR, and therefore the faster ATR reacts to changing volatility.
The exact formula how the smoothing factor a is calculated from ATR period n is what makes the two methods different.
Wilder's method a = 1 / n
EMA method a = 2 / ( n + 1 )
If you quickly calculate a for both methods with n = 5, you will find that Wilder's a = 20% and EMA a = 33.3%. EMA ATR is much faster to react to market changes than Wilder's ATR with the same period (approximately by a factor of 2 for longer periods).
Comparing Period Effect under All Methods
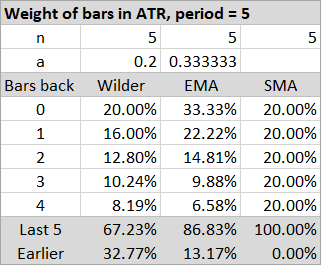
The table below shows weights of each bar's true range in the resulting ATR. It compares the three methods, all with period length set to 5.

At the bottom you can the total weight of the last 5 bars. As expected, it is 100% for SMA ATR, but less for the other methods and only about two thirds for Wilder's ATR. That is far from being the average of last 5 days, because one third of the ATR is actually a result of volatility from the earlier bars.
We can conclude that with the same period length, Wilder's method is the slowest and has the biggest drag – the biggest weight of bars longer into history. The EMA method is the fastest to react to changing market conditions, with greatest weights of the two latest bars, but at the same time more than 13% of its value reflects the market's action before the last 5 bars.
SMA ATR is the easiest to interpret, as it only considers the n last bars (where n is the period) and each of these has the same weight (1/n). Beyond this rolling window the weights immediately drop to zero.
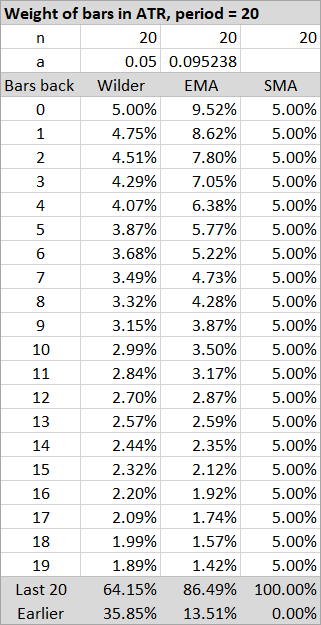
Let's see one more example, this time with ATR period set to 20:

Again, you can see the weight of last 20 bars is only 64.15% in the original Wilder's ATR with period set to 20.
So Which Period Is Best?
I won't tell you which is "best", but I can tell you which periods appear to be the most popular based on trading literature and various software default settings. Two numbers that repeatedly turn up are 14 and 20.
If that's important to you (it shouldn't be), two ATR periods that J. Welles Wilder himself mentions in his book are 7 and 14. But most likely he was using the indicator for different style of trading than you are, in different markets, and in 1978.
Conclusion
The key things to remember when deciding which ATR period you should use are the following:
- The effect of period setting on ATR is calculation method specific.
- Except for the SMA ATR method (which is not the original ATR), period does not mean number of days or bars. It only means how fast or slow ATR is in general.
- When using SMA ATR and daily data: 5 = 1 week, 10 = 2 weeks, 21 = 1 month, 63 = 3 months, 252 = 1 year.
- Consistency – using the same calculation method and the same period(s) – is more important than whether you choose 20 or 21.
- There is no best method and no best period. When selecting the ones most suitable to you, consider the market you trade, time horizon, trading style, but also your technology and work process (SMA ATR is easiest to calculate and understand).
- Test everything.