Not only that stocks are making new all-time highs and VIX is near its 2013 and multi-year lows, but also the volatility of VIX itself is near long-term lows. This is true for both implied volatility, measured by the VVIX index, and realized volatility of VIX.
VIX Implied Volatility (VVIX)
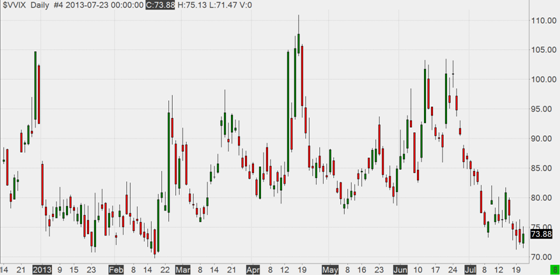
In the last few days the VVIX has been in low 70's. It was this low also in January and February, but since February it was consistently higher for more than 4 months (even in March when the VIX was below 12):
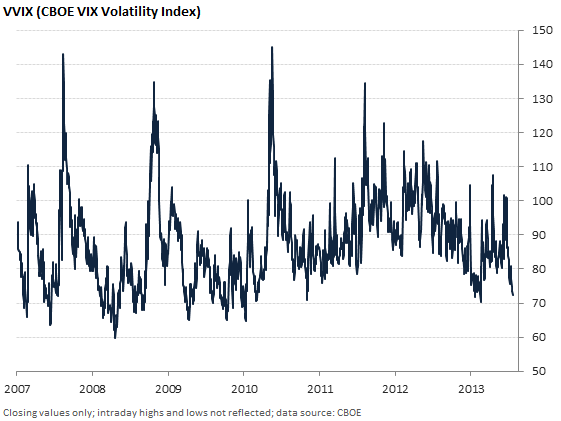
Below you can see a longer term chart of VVIX, starting in 2007 (full history that is available on the CBOE website). The absolute lowest VVIX close was 59.74 on 4/23/2008 (VIX was 20.26 that day).
VIX Historical Volatility
Realized volatility has also been near lows recently. Measured over the last 15 trading days (since the start of July) ending yesterday it is 54% (standard deviation method) or 62% (zero mean method). The difference is caused by the relatively steady recent downtrend in VIX. In the chart below you can see 15-day HV (stdev) since early 2009 (approximately since the start of this bull market):
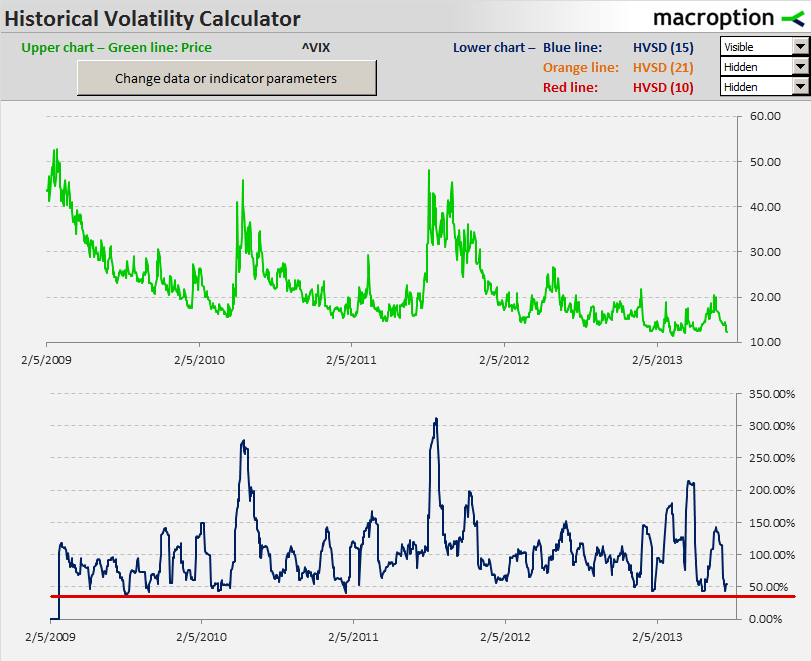
You can see that 40-50% has been the low, reached on multiple occasions, and usually followed by sharp increase. For comparison, realized volatility measured over the last 252 trading days (about one year) is 110% (both methods).
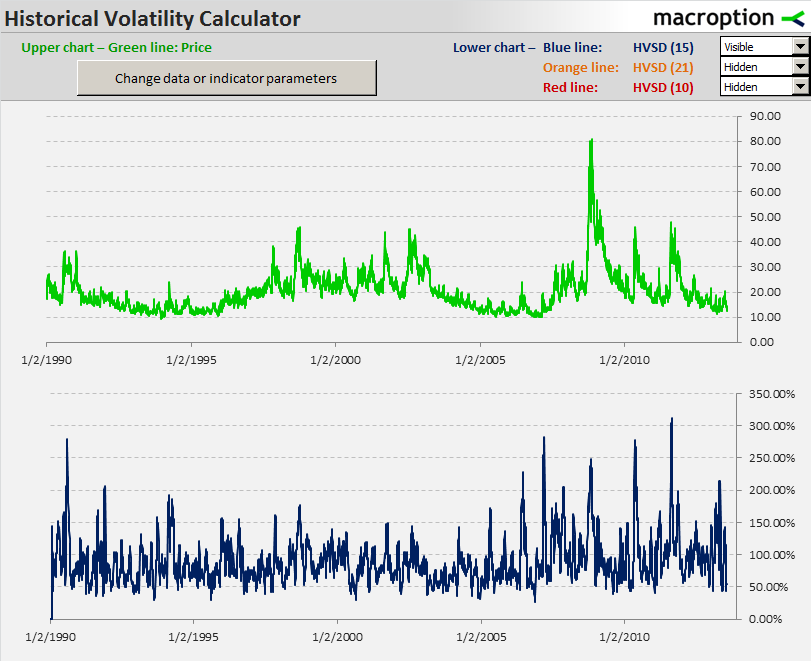
To put it in even longer term perspective, below is the chart since 1990:
VIX and VVIX Relationship
There is obviously a positive relationship between VIX and VVIX.
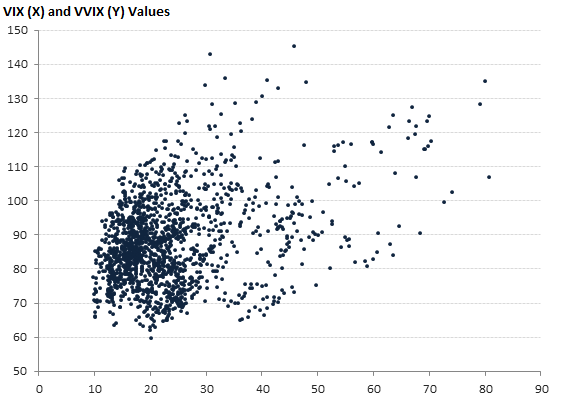
VVIX (and also realized volatility of VIX) tends to be higher when the values of VIX itself are higher. But looking at the scatter plot, the relationship is much less perfect than you would think. The correlation using all available data (since 2007) is only 0.35:
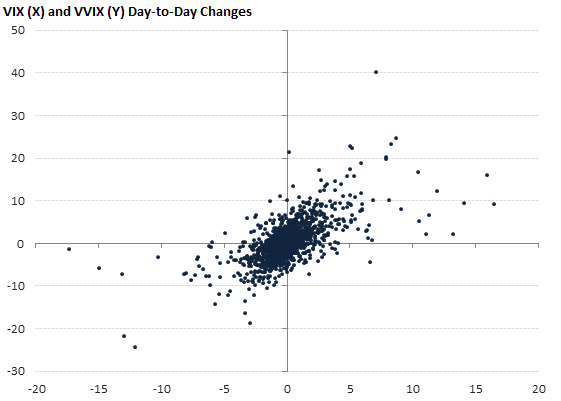
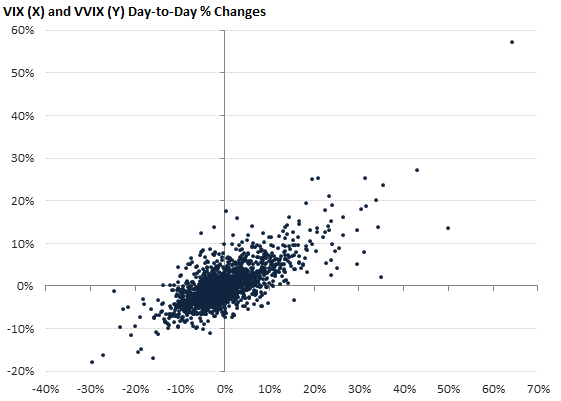
It makes much more sense to look at the relationship between day-to-day (absolute or percentage) changes rather than the values. The relationship is much stronger here. The correlations are 0.64 (absolute changes) and 0.74 (percentage changes):
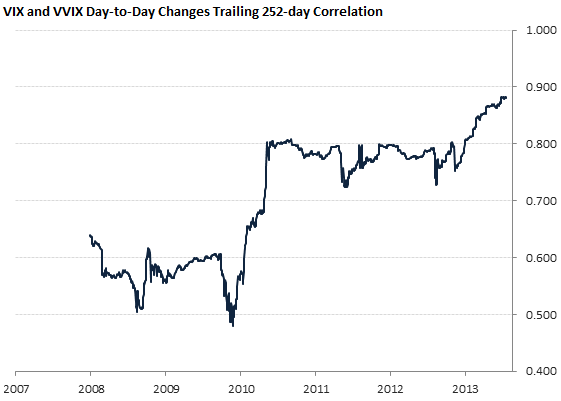
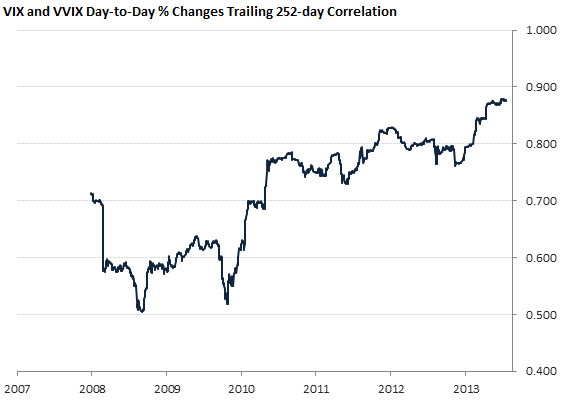
In the last charts below you can see how the correlations have developed over time. The correlation of VIX and VVIX values has fluctuated from below zero to above 0.80.
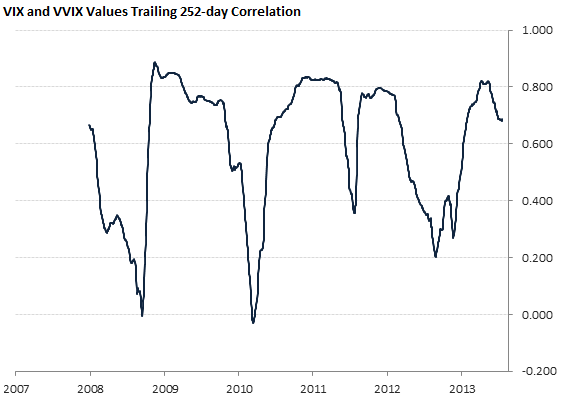
The correlations of day-to-day changes have been much more stable over time, staying above 0.70 in the recent bull market years (you can see that the sharp up move from the 50's to the 70's occurred in the first half of 2010, when the data before March 2009 stock market low dropped out of the sample). The correlation of both absolute and percentage VIX and VVIX changes has recently made new highs, approaching 0.90:
Note: When looking at longer history we must keep in mind that the market for VIX options was quite different (in terms of activity) in 2007 or 2008 from what it is now.