VIX Chart

VIX Index Chart

The following are long-term historical charts of the VIX (CBOE Volatility Index).
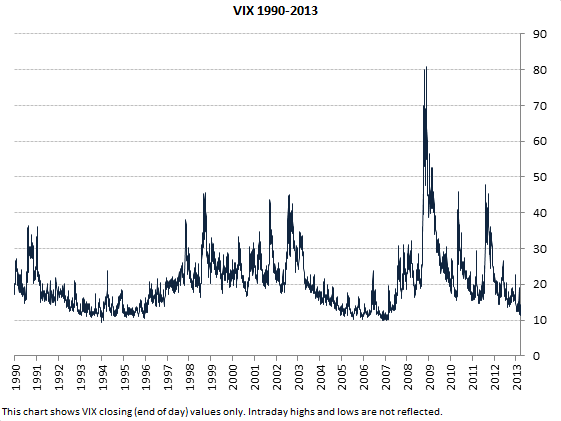
VIX long term chart (1990-2013, closing values only)

As you can see, the lows in VIX have been just below 10, while it reached almost 90 during the heat of the financial crisis in autumn 2008. The long-term average value of VIX Index has been somewhere between 20 and 22.

Here you can see more details about the highest VIX closing and intraday values in history:

VIX All-Time High

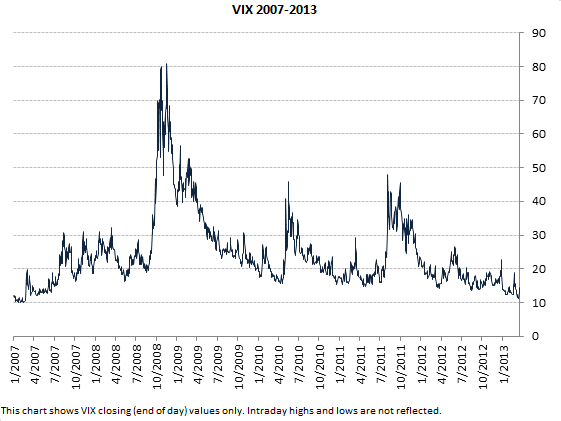
VIX Chart, 2007-2013

VIX long term chart (2007-2013, closing values only)

VIX Live Chart

You can find live VIX charts on the official website of CBOE or on major financial portals such as Bloomberg or CNBC. These charts are updated intraday, but still delayed a few minutes. For real-time live VIX charts, you will need to have an online brokerage account or subscribe to a paid market data service.

By remaining on this website or using its content, you confirm that you have read and agree with the Terms of Use Agreement.

We are not liable for any damages resulting from using this website. Any information may be inaccurate or incomplete. See full Limitation of Liability.

Content may include affiliate links, which means we may earn commission if you buy on the linked website. See full Affiliate and Referral Disclosure.

We use cookies and similar technology to improve user experience and analyze traffic. See full Cookie Policy.

See also Privacy Policy on how we collect and handle user data.

© 2024 Macroption