S&P 500 Holds Gains
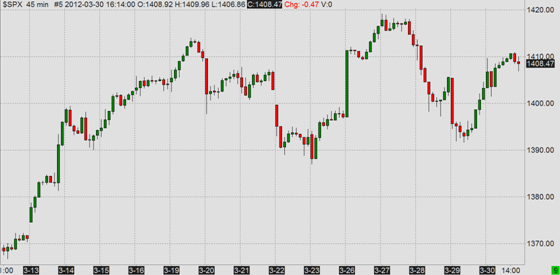
S&P 500 Index (SPX) held its recent gains last week, made new post-Lehman closing high (1416.51) on Monday and new intraday high (1419.15) on Tuesday. It ended the week at 1408.47 on Friday, up from 1397.11 the week before. Realized volatility continued to slowly increase from the extremely low levels that we saw in January and February. 21-day historical volatility of S&P 500 was 11.68% (annualized) on Friday.
Spot VIX Still Sideways, with Slight Expansion of Range
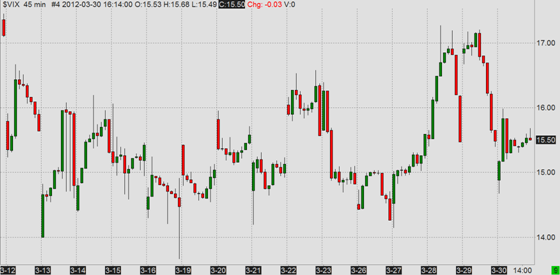
The sideways move in spot VIX has continued for the third week in a row. Nevertheless, the range expanded a bit to the upside in the second half of the week and we have seen spot VIX above 17 for the first time since 9 March on Wednesday and Thursday (at least on intraday basis).
Same or Very Similar VIX Closes 3 Days in a Row
Interestingly, while the VIX was quite volatile intraday, the closing values on the 3 trading days from Wednesday to Friday were within 0.03 VIX points (15.47 – 15.48 – 15.50). There were 2 occurrences in history when the VIX had exactly the same closing value for 3 consecutive days (13.42 on 18, 19, and 22 August 2005 and 13.18 on 26, 27, and 28 July 1995 – the latter was before the new methodology was introduced in 2003; the data is the backcalculated new VIX). There have been a total of 9 occasions (including the current one) when 3 consecutive VIX closes were within 0.03 or fewer VIX points – the most recent before the current one was in December 2010.
The VIX never had the same closing value for more than 3 trading days in a row.
Of course these are just a few interesting observations – I just wanted to share with you a quick analysis I did out of curiosity rather than anything else (it is not likely to provide foundation for any significant odds for the future SPX or VIX direction).
VIX Futures Curve Shifts Down
What is more meaningful for actual trading is... VIX futures curve. Although spot VIX has remained the same for 3 weeks, the futures curve has shifted down markedly in the last 2 weeks. The downward move started to gain traction around March 2012 VIX expiration 2 weeks ago – first on the short end of the futures curve (especially April and May). Last week, more distant futures months lost more value and the curve flattened (April VIX futures remained virtually unchanged last week and spot VIX even increased slightly).
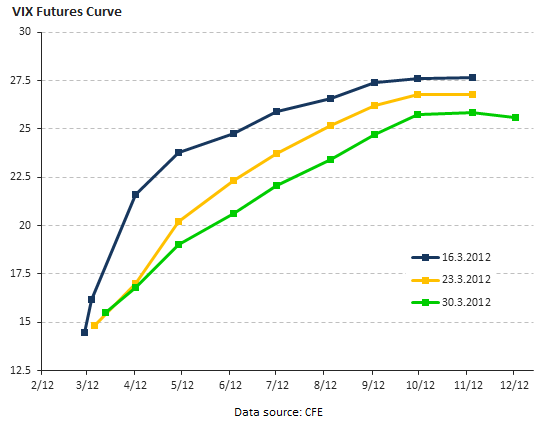
Translated to human language (for those of you less familiar with VIX derivatives), the market's expectations of next month's S&P 500 volatility (spot VIX) didn't change much in the last 3 weeks, but expected volatility for more distant future (the rest of 2012; VIX futures curve) decreased. Very roughly, it means that investors are now considering a bigger decline in stock prices in the next several months less likely than they did 2 or 3 weeks ago.
VXV Index Underperforms VIX
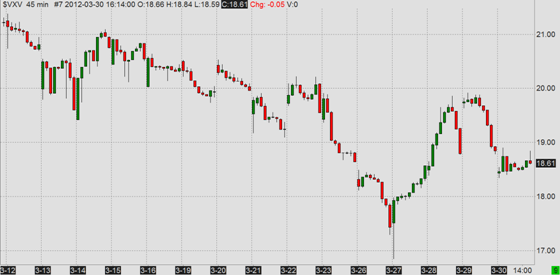
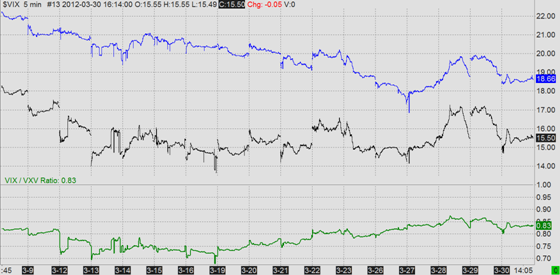
In line with declining medium-term volatility expectations, the VXV Index has significantly underperformed VIX. VXV Index measures implied volatility of S&P 500 options for the next 93 days; it is calculated using the same logic as VIX, which measures 30-day implied volatility. The interpretation (the period for which expected volatility is measured) is different for VXV and VIX futures expiring in 2-3 months, but when medium-term volatility expectations move as sharply as they have recently, the message of the two is usually in line.
VXV Index
VIX/VXV Ratio
The Week Ahead in Macro + Easter Holiday
This week is the start of 2Q 2012 and it is also the Easter week. There will be important US macro data coming out, especially nonfarm payrolls and unemployment on Friday, when major US exchanges will be closed for Good Friday Holiday. There will also be central bank monetary policy announcements in Australia (Tuesday), Eurozone (Wednesday), and the UK (Thursday). Also watch Eurozone macro data (PMI, unemployment, GDP, PPI) and, as usual, anything related to Greece, Portugal, and the debt crisis.