Although it may seem obvious to a professional, this question is quite frequently asked by people less experienced with options and volatility:
Can (historical or implied) volatility be a negative number?
Volatility Can Never Be Negative
Historical volatility, as well as implied volatility and volatility in general, can never be negative. In other words, it can reach values from zero to positive infinite only.
Let me provide two explanations, a common sense one and a mathematical one.
Common Sense Explanation
Let's start with what volatility is. In general, volatility is how much something moves. The direction of the moves (up or down) does not matter – only the size. A security that has constant price has no volatility – the volatility of zero.
For example, there could be a stock that for some reason (for example upcoming acquisition that is already 100% sure) had constant price of let's say 50 dollars, without any fluctuations. If you calculated historical volatility of that stock, you would always get zero. All fairly priced options on that stock would have zero implied volatility and zero time value, regardless of strike price or time to expiration (assuming no dividends and zero interest rates).
Could you find a stock with even lower volatility than the one above? Can something move less than not move at all? No. This is why zero volatility is the lowest possible volatility anything can have.
The more a security tends to move, the higher volatility it has. For example, shares in companies from the mining industry usually have high volatility and their prices often move by 2% or more in a single day. On the contrary, telecom stocks or utilities tend to have lower volatility and bigger moves are far less common on them.
Forex: Volatility of Fixed Exchange Rate is Zero
In forex, some currency pairs typically have higher volatility than others. For example EUR/JPY is much more volatile than DKK/SEK.
Some currencies have fixed or almost fixed exchange rates and in such case their volatility is at or near zero.
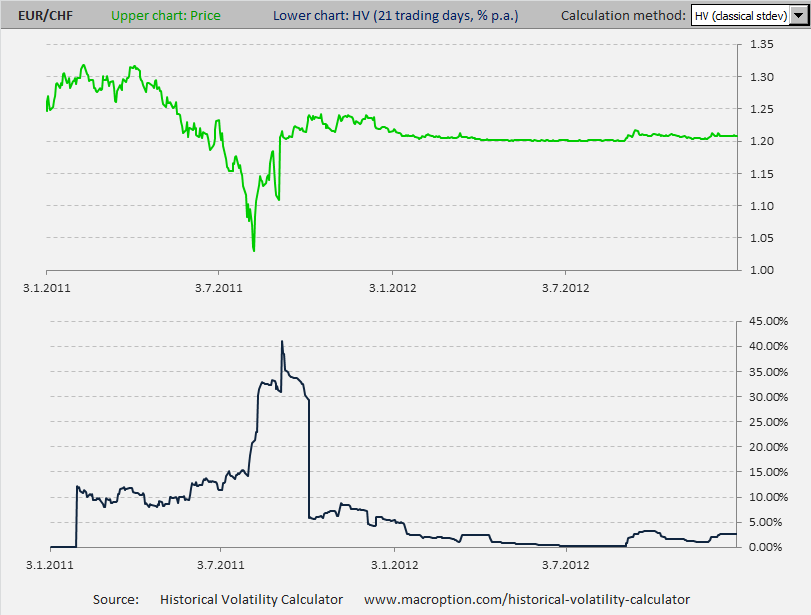
A good recent example among the G10 currencies is EUR/CHF, where the Swiss National Bank didn't want to allow the Swiss Franc to appreciate beyond 1.20 against the Euro (in order to protect Swiss exporters and the economy). As a result, the EUR/CHF exchange rate was in a narrow range between 1.20 and 1.22 for the whole 2012 and its historical volatility was below 5% (and often below 1%). See the chart:

The chart above is EUR/CHF in 2011-2012, created in the Historical Volatility Calculator. The upper chart (green) is the exchange rate itself and the lower chart (blue) is 21-day historical volatility. You can see that in 2011, before the Swiss National Bank intervened, the exchange rate was very volatile, but in 2012 (the right half of the chart) the rate was almost constant and its volatility was almost zero.
In general, when a price or rate is constant (straight line on the chart), historical volatility is zero. But you can't get more constant than entirely constant or more straight than entirely straight. And volatility can't get lower than zero.
Mathematical Explanation
The fact that historical volatility can not be negative is also clear from its calculation. The most common approach to historical volatility calculation (explained here) is the standard deviation of logarithmic returns. Don't worry if you don't know what logarithmic return is – the standard deviation is the only thing you need now to see that volatility can't be negative.
Standard deviation is calculated as the square root of average squared deviation from the mean (calculation explained here). Of course, a squared number can never be negative. In case of historical volatility, any squared deviation from the mean (return) can never be negative and therefore the average squared deviation from the mean can never be negative either. And the squared root of that, which is historical volatility, can never be negative either.
For details, see Calculating Variance and Standard Deviation in 4 Easy Steps and Historical Volatility Calculation.